Recently, the presidential candidate Donal Trump has become controversial. Particularly, associated with his provocative call to temporarily bar Muslims from entering the US, he has faced strong criticism.
Some of the many uses of social media analytics is sentiment analysis where we evaluate whether posts on a specific issue are positive or negative. We can integrate R and Tableau for text data mining in social media analytics, machine learning, predictive modeling, etc., by taking advantage of the numerous R packages and compelling Tableau visualizations.
In this post, let’s mine tweets and analyze their sentiment using R. We will use Tableau to visualize our results. We will see spatial-temporal distribution of tweets, cities and states with top number of tweets and we will also map the sentiment of the tweets. This will help us to see in which areas his comments are accepted as positive and where they are perceived as negative.
Load required packages:
library(twitteR)
library(ROAuth)
require(RCurl)
library(stringr)
library(tm)
library(ggmap)
library(dplyr)
library(plyr)
library(tm)
library(wordcloud)
Get Twitter authentication
All information below is obtained from twitter developer account. We will set working directory to save our authentication.
key="hidden"
secret="hidden"
setwd("/text_mining_and_web_scraping")

download.file(url="http://curl.haxx.se/ca/cacert.pem",
              destfile="/text_mining_and_web_scraping/cacert.pem",
              method="auto")
authenticate <- OAuthFactory$new(consumerKey=key,
                                 consumerSecret=secret,
                                 requestURL="https://api.twitter.com/oauth/request_token",
                                 accessURL="https://api.twitter.com/oauth/access_token",
                                 authURL="https://api.twitter.com/oauth/authorize")
setup_twitter_oauth(key, secret)
save(authenticate, file="twitter authentication.Rdata")
Get sample tweets from various cities
Let’s scrape most recent tweets from various cities across the US. Let’s request 2000 tweets from each city. We will need the latitude and longitude of each city.
N=2000  # tweets to request from each query
S=200  # radius in miles
lats=c(38.9,40.7,37.8,39,37.4,28,30,42.4,48,36,32.3,33.5,34.7,33.8,37.2,41.2,46.8,
       46.6,37.2,43,42.7,40.8,36.2,38.6,35.8,40.3,43.6,40.8,44.9,44.9)

lons=c(-77,-74,-122,-105.5,-122,-82.5,-98,-71,-122,-115,-86.3,-112,-92.3,-84.4,-93.3,
       -104.8,-100.8,-112, -93.3,-89,-84.5,-111.8,-86.8,-92.2,-78.6,-76.8,-116.2,-98.7,-123,-93)

#cities=DC,New York,San Fransisco,Colorado,Mountainview,Tampa,Austin,Boston,
#       Seatle,Vegas,Montgomery,Phoenix,Little Rock,Atlanta,Springfield,
#       Cheyenne,Bisruk,Helena,Springfield,Madison,Lansing,Salt Lake City,Nashville
#       Jefferson City,Raleigh,Harrisburg,Boise,Lincoln,Salem,St. Paul

donald=do.call(rbind,lapply(1:length(lats), function(i) searchTwitter('Donald+Trump',
              lang="en",n=N,resultType="recent",
              geocode=paste(lats[i],lons[i],paste0(S,"mi"),sep=","))))
Let’s get the latitude and longitude of each tweet, the tweet itself, how many times it was re-twitted and favorited, the date and time it was twitted, etc.
donaldlat=sapply(donald, function(x) as.numeric(x$getLatitude()))
donaldlat=sapply(donaldlat, function(z) ifelse(length(z)==0,NA,z))

donaldlon=sapply(donald, function(x) as.numeric(x$getLongitude()))
donaldlon=sapply(donaldlon, function(z) ifelse(length(z)==0,NA,z))

donalddate=lapply(donald, function(x) x$getCreated())
donalddate=sapply(donalddate,function(x) strftime(x, format="%Y-%m-%d %H:%M:%S",tz = "UTC"))

donaldtext=sapply(donald, function(x) x$getText())
donaldtext=unlist(donaldtext)

isretweet=sapply(donald, function(x) x$getIsRetweet())
retweeted=sapply(donald, function(x) x$getRetweeted())
retweetcount=sapply(donald, function(x) x$getRetweetCount())

favoritecount=sapply(donald, function(x) x$getFavoriteCount())
favorited=sapply(donald, function(x) x$getFavorited())

data=as.data.frame(cbind(tweet=donaldtext,date=donalddate,lat=donaldlat,lon=donaldlon,
                           isretweet=isretweet,retweeted=retweeted, retweetcount=retweetcount,favoritecount=favoritecount,favorited=favorited))
First, let’s create a word cloud of the tweets. A word cloud helps us to visualize the most common words in the tweets and have a general feeling of the tweets.
# Create corpus
corpus=Corpus(VectorSource(data$tweet))

# Convert to lower-case
corpus=tm_map(corpus,tolower)

# Remove stopwords
corpus=tm_map(corpus,function(x) removeWords(x,stopwords()))

# convert corpus to a Plain Text Document
corpus=tm_map(corpus,PlainTextDocument)

col=brewer.pal(6,"Dark2")
wordcloud(corpus, min.freq=25, scale=c(5,2),rot.per = 0.25,
          random.color=T, max.word=45, random.order=F,colors=col)
Here is the word cloud:
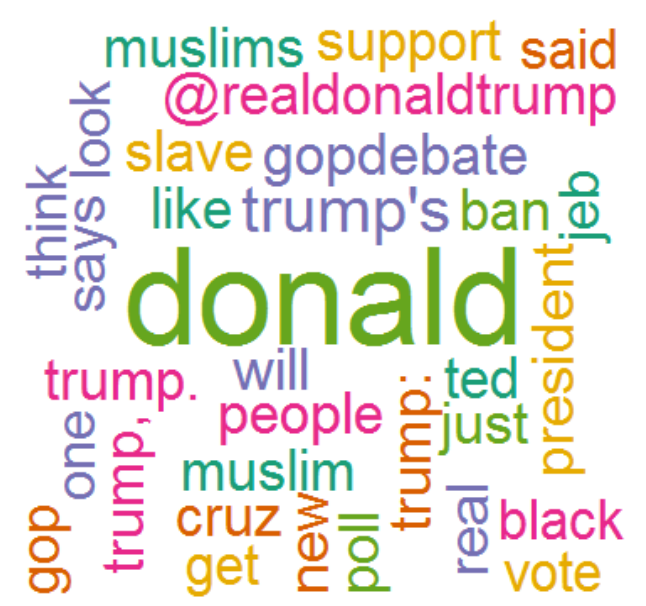
We see from the word cloud that among the most frequent words in the tweets are ‘muslim’, ‘muslims’, ‘ban’. This suggests that most tweets were on Trump’s recent idea of temporarily banning Muslims from entering the US.
The dashboard below shows time series of the number of tweets scraped. We can change the time unit between hour and day and the dashboard will change based on the selected time unit. Pattern of number of tweets over time helps us to drill in and see how each activities/campaigns are being perceived.
Here is the screenshot. (View it live in this link)

Getting address of tweets
Since some tweets do not have lat/lon values, we will remove them because we want geographic information to show the tweets and their attributes by state, city and zip code.
data=filter(data, !is.na(lat),!is.na(lon))
lonlat=select(data,lon,lat)
Let’s get full address of each tweet location using the google maps API. The ggmaps package is what enables us to get the street address, city, zipcode and state of the tweets using the longitude and latitude of the tweets. Since the google maps API does not allow more than 2500 queries per day, I used a couple of machines to reverse geocode the latitude/longitude information in a full address. However, I was not lucky enough to reverse geocode all of the tweets I scraped. So, in the following visualizations, I am showing only some percentage of the tweets I scraped that I was able to reverse geocode.
result <- do.call(rbind, lapply(1:nrow(lonlat),
                     function(i) revgeocode(as.numeric(lonlat[i,1:2]))))
If we see some of the values of result, we see that it contains the full address of the locations where the tweets were posted.
result[1:5,]
     [,1]
[1,] "1778 Woodglo Dr, Asheboro, NC 27205, USA"
[2,] "1550 Missouri Valley Rd, Riverton, WY 82501, USA"
[3,] "118 S Main St, Ann Arbor, MI 48104, USA"
[4,] "322 W 101st St, New York, NY 10025, USA"
[5,] "322 W 101st St, New York, NY 10025, USA"
So, we will apply some regular expression and string manipulation to separate the city, zip code and state into different columns.
data2=lapply(result,  function(x) unlist(strsplit(x,",")))
address=sapply(data2,function(x) paste(x[1:3],collapse=''))
city=sapply(data2,function(x) x[2])
stzip=sapply(data2,function(x) x[3])
zipcode = as.numeric(str_extract(stzip,"[0-9]{5}"))
state=str_extract(stzip,"[:alpha:]{2}")
data2=as.data.frame(list(address=address,city=city,zipcode=zipcode,state=state))
Concatenate data2 to data:
data=cbind(data,data2)
Some text cleaning:
tweet=data$tweet
tweet_list=lapply(tweet, function(x) iconv(x, "latin1", "ASCII", sub=""))
tweet_list=lapply(tweet_list, function(x) gsub("htt.*",' ',x))
tweet=unlist(tweet_list)
data$tweet=tweet
We will use lexicon based sentiment analysis. A list of positive and negative opinion words or sentiment words for English was downloaded from here.
positives= readLines("positivewords.txt")
negatives = readLines("negativewords.txt")
First, let’s have a wrapper function that calculates sentiment scores.
sentiment_scores = function(tweets, positive_words, negative_words, .progress='none'){
  scores = laply(tweets,
                 function(tweet, positive_words, negative_words){
                 tweet = gsub("[[:punct:]]", "", tweet)    # remove punctuation
                 tweet = gsub("[[:cntrl:]]", "", tweet)   # remove control characters
                 tweet = gsub('\\d+', '', tweet)          # remove digits

                 # Let's have error handling function when trying tolower
                 tryTolower = function(x){
                     # create missing value
                     y = NA
                     # tryCatch error
                     try_error = tryCatch(tolower(x), error=function(e) e)
                     # if not an error
                     if (!inherits(try_error, "error"))
                       y = tolower(x)
                     # result
                     return(y)
                   }
                   # use tryTolower with sapply
                   tweet = sapply(tweet, tryTolower)
                   # split sentence into words with str_split function from stringr package
                   word_list = str_split(tweet, "\\s+")
                   words = unlist(word_list)
                   # compare words to the dictionaries of positive & negative terms
                   positive_matches = match(words, positive_words)
                   negative_matches = match(words, negative_words)
                   # get the position of the matched term or NA
                   # we just want a TRUE/FALSE
                   positive_matches = !is.na(positive_matches)
                   negative_matches = !is.na(negative_matches)
                   # final score
                   score = sum(positive_matches) - sum(negative_matches)
                   return(score)
                 }, positive_matches, negative_matches, .progress=.progress )
  return(scores)
}

score = sentiment_scores(tweet, positives, negatives, .progress='text')
data$score=score
Let’s plot a histogram of the sentiment score:
hist(score,xlab=" ",main="Sentiment of sample tweets\n that have Donald Trump in them ",
     border="black",col="skyblue")
Here is the plot:
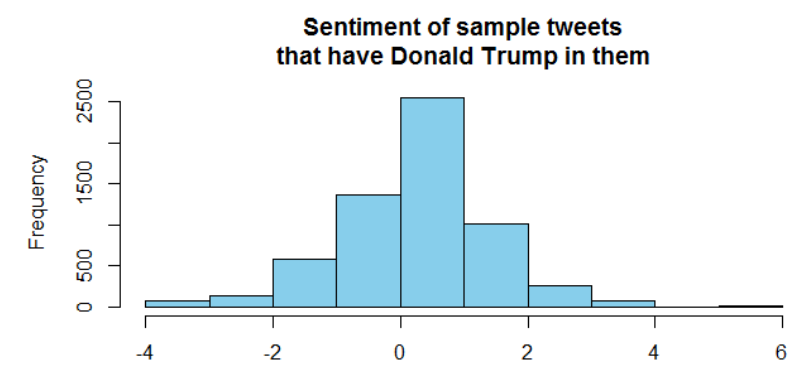
We see from the histogram that the sentiment is slightly positive. Using Tableau, we will see the spatial distribution of the sentiment scores.
Save the data as csv file and import it to Tableau
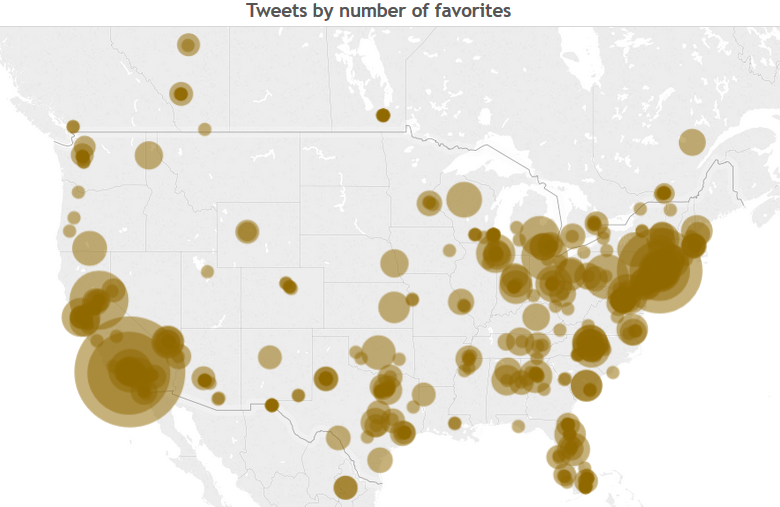
The map below shows the tweets that I was able to reverse geocode. The size is proportional to the number of favorites each tweet got. In the interactive map, we can hover over each circle and read the tweet, the address it was tweeted from, and the date and time it was posted.
Here is the screenshot (View it live in this link)
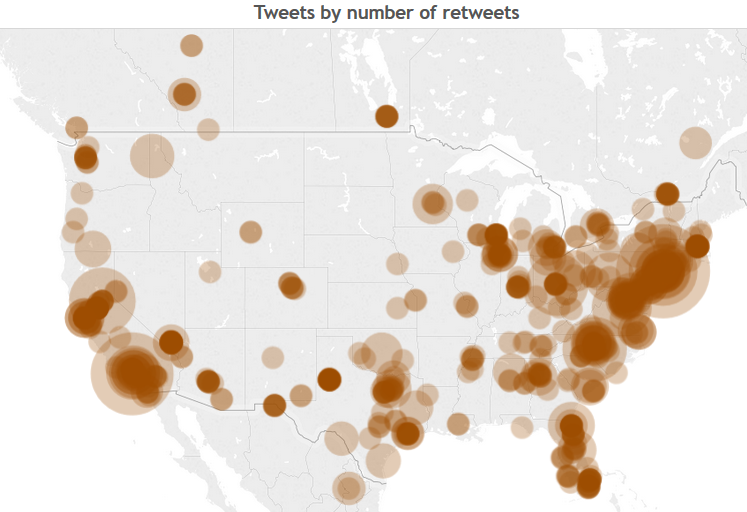
Similarly, the dashboard below shows the tweets and the size is proportional to the number of times each tweet was retweeted.
Here is the screenshot (View it live in this link)
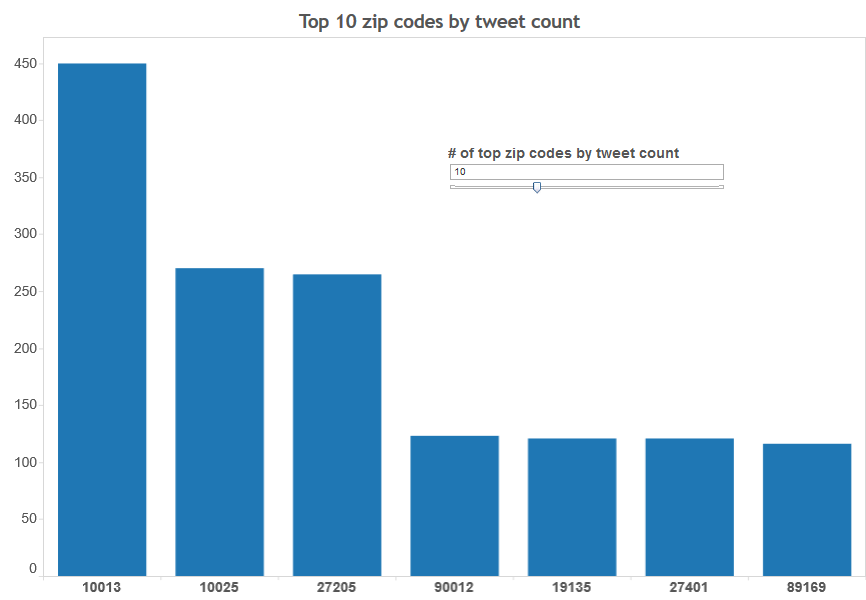
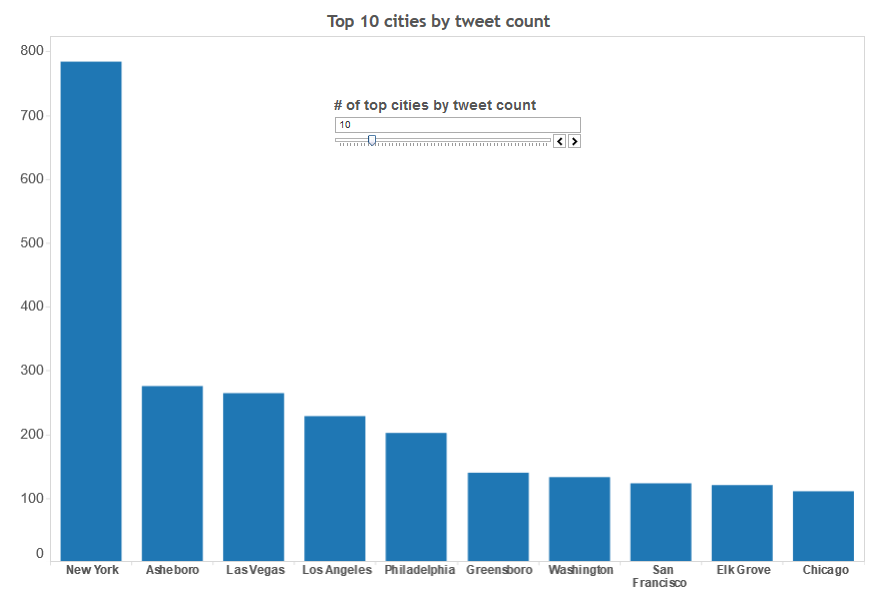
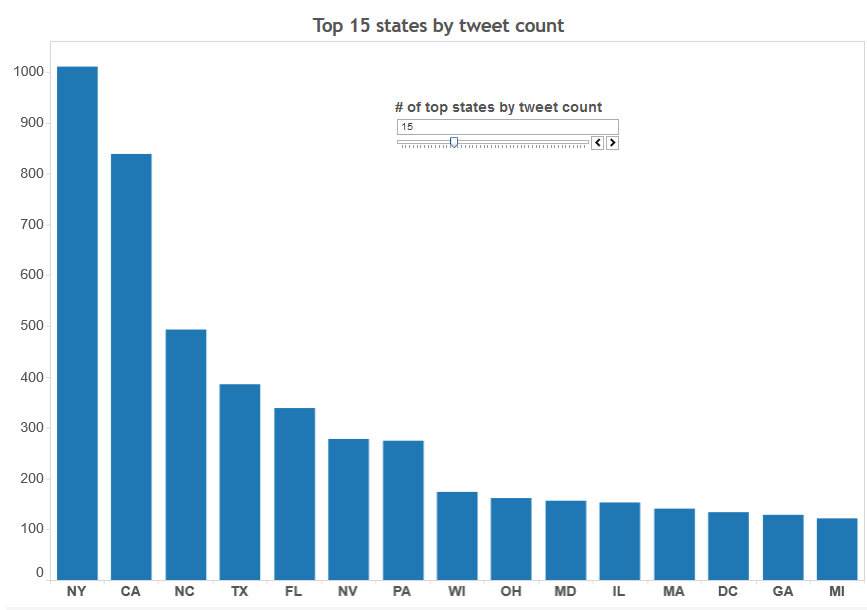
In the following three visualizations, top zip codes, cities and states by the number of tweets are shown. In the interactive map, we can change the number of zip codes, cities and states to display by using the scrollbars shown in each viz. These visualizations help us to see the distribution of the tweets by zip code, city and state.
By zip code
Here is the screenshot (View it live in this link)
By city
Here is the screenshot (View it live in this link)
By state
Here is the screenshot (View it live in this link)
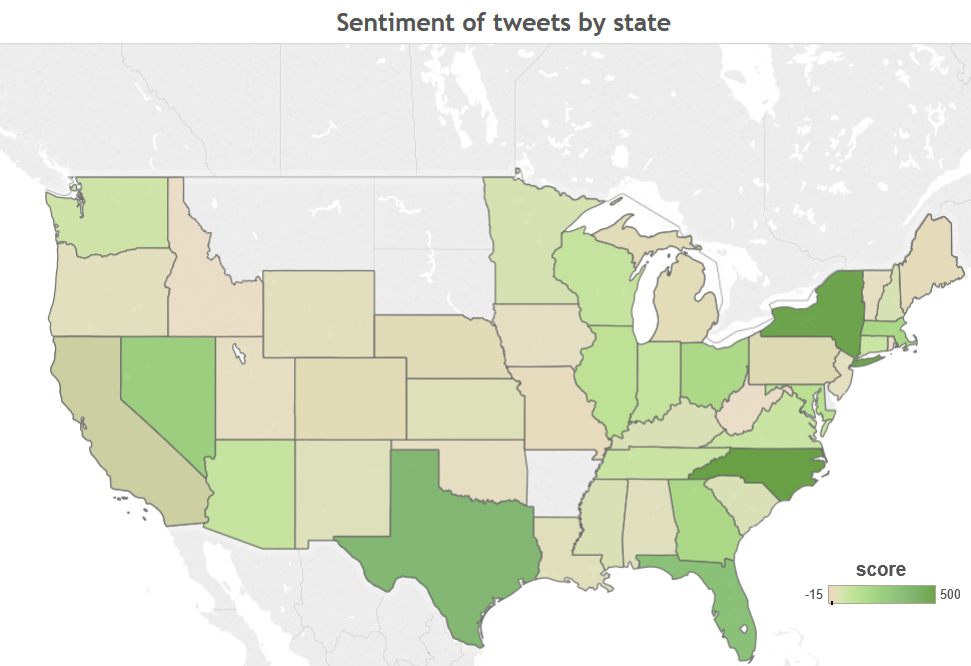
Sentiment of tweets
Sentiment analysis has myriads of uses. For example, a company may investigate what customers like most about the company’s product, and what are the issues the customers are not satisfied with? When a company releases a new product, has the product been perceived positively or negatively? How does the sentiment of the customers vary across space and time? In this post, we are evaluating, the sentiment of tweets that we scraped on Donald Trump.
The viz below shows the sentiment score of the reverse geocoded tweets by state. We see that the tweets have highest positive sentiment in NY, NC and Tx.
Here is the screenshot (View it live in this link)
Summary
In this post, we saw how to integrate R and Tableau for text mining, sentiment analysis and visualization. Using these tools together enables us to answer detailed questions.
We used a sample from the most recent tweets that contain Donald Trump and since I was not able to reverse geocode all the tweets I scraped because of the constraint imposed by google maps API, we just used about 6000 tweets. The average sentiment is slightly above zero. Some states show strong positive sentiment. However, statistically speaking, to make robust conclusions, mining ample size sample data is important.
The accuracy of our sentiment analysis depends on how fully the words in the the tweets are included in the lexicon. Moreover, since tweets may contain slang, jargon and collequial words which may not be included in the lexicon, sentiment analysis needs careful evaluation.
This is enough for today. I hope you enjoyed it! If you have any questions or feedback, feel free to leave a comment.


Hi, I have zero skills when it comes to anything like this but am on a fast learning curve. Can this be adjusted so it’s pulling data via a specific date or period in time?
Hi, I am following the code you have provided and working on the same sample. I keep getting error when i try to get the address of the tweets, this is the error i am getting.
can someone please help me sort this
thank you in advance
In revgeocode(as.numeric(lonlat[i, 1:2])) :
reverse geocode failed – bad location? location = “1”reverse geocode failed – bad location? location = “2”
2: In revgeocode(as.numeric(lonlat[i, 1:2])) :
reverse geocode failed – bad location? location = “1”reverse geocode failed – bad location? location = “2”
3: In revgeocode(as.numeric(lonlat[i, 1:2])) :
reverse geocode failed – bad location? location = “3”reverse geocode failed – bad location? location = “1”
4: In revgeocode(as.numeric(lonlat[i, 1:2])) :
reverse geocode failed – bad location? location = “2”reverse geocode failed – bad location? location = “3”
Hi Friends, this is a very inspiring article as it combines R and Tableau in the analysis.
When I tried doing a similar analysis I had problems with the following functions getLatitude(), getLongitude() , getCreated() etc.
I would really appreciate any direction of fixing the error, thanks.
Excellent article! When I try to do it however I do no get ANY long and lat values? Any thoughts where this might go wrong?
hi friends
when i tried the codes,i got the message in the screenshot attached.
what does it mean?please help me find a solution
thank you
Hi! I keep getting the below error. Every other step works. I’m using my own twitter data loaded as a df. Could there be an issue there?
Hi, great article. Just an aside though, might come in handy. the twListToDF function easily converts the tweets data into a handy data frame.! 🙂
aghh…it saves lots of code lines. sad that i realized it too late. anyways, thanks for the tip.
Hello Fissheha, Can you please help me to identify the script which helps to save the data to csv file. Thanks.
Hai Fissheha, while trying to gather the address of the tweets, am seeing the below errors.
> data=filter(data, !is.na(lats),!is.na(lons))
Error in match.arg(method) : ‘arg’ must be NULL or a character vector
> lonlat=select(data,lon,lat)
Error: could not find function “select”
Please advise.
Hi, Another challenge am facing with the unclean inputs. Please suggest if there is any smart way to do this. Tried few online suggestions but they ended up not much help.
> corpus=Corpus(VectorSource(data$tweet))
> corpus=tm_map(corpus,tolower)
Error in FUN(X[[i]], …) :
invalid input ‘| “Lil Durk 2016” | Artistí ¼í¾¨: @quincy_prescott #adobe #artxxv #graphicdesigner #bookmenow… https://t.co/BPYoA2blKB‘ in ‘utf8towcs’
Below helped me to overcome the challenge…
# To Clean the special characters from the tweet data
usableText=str_replace_all(data$tweet,”[^[:graph:]]”, ” “)
###############################################
# Create corpus
corpus=Corpus(VectorSource(usableText))
Hi Fisseha Berhane, this has been turning out to be very helpful article to learn…
BTW, am ending up with the below error while trying to set the Authentication. can you please suggest if am missing anything here. Thanks…
> twitCred <- OAuthFactory$new(consumerKey=consumerKey,consumerSecret=consumerSecret,requestURL=reqURL,accessURL=accessURL,authURL=authURL)
Error: object 'OAuthFactory' not found
Did you create an account here: https://dev.twitter.com/?
You will get every information from your account
Thanks for the prompt response. I realized that I just need to enable the ROAuth for this. Thanks again.
library(ROAuth)
Can you explain these two lines of the code:
donaldtext=sapply(donald, function(x) x$getText())
donaldtext=unlist(donaldtext)
More specifically, where is the getText() function defined?
I’m getting a blank result. Trying to figure out what my problem is. Everything else works before this step and all the other fields (e.g., donaldlat, donalddate, retweeted, etc.) are being populated just not donaldtext.
This is an excellent post. Thank you!
getText() is a method.
example:
x=searchTwitter(‘donald’,n=1)
str(x)
gives
……..
getCreated, getFavoriteCount, getFavorited, getId, getIsRetweet, getLatitude, getLongitude, getReplyToSID, getReplyToSN, getReplyToUID,
.. getRetweetCount, getRetweeted, getRetweeters, getRetweets, getScreenName, getStatusSource, getText,……
Hi Ryan, could you please give me directions on how you were able to get the donaldlat, donalddate, retweeted etc. populated, I am get blank data when I tried to run them
Nice! I want to replicate, then play with, this example. I’m getting the following error:
authenticate <- OAuthFactory$new(consumerKey=,
+ consumerSecret= …. [TRUNCATED]
Error in initRefFields(.self, .refClassDef, as.environment(.self), list(…)) :
object ” not found
I’m not very experienced at connecting R to APIs (obviously). Can someone coach me through this error? Thanks!
Absolutely brilliant stuff 🙂 Only thing i’d add is that you should clean the dataset prior to doing to wordchart… i encountered a few issues until cleaned urls ect.. from the set
Just one question 🙂 Running the final sentiment, i get the following error –
Error in match(words, positive_words) :
object ‘positive_matches’ not found
Do you get the same error on your side ? (I have uploaded the lists from the site you mentioned)
Thanks. fixed it!
Still the same error, thanks for replying though 🙂
did you change “positive.matches” to “positive_matches”? It was inconsistency in the variable naming.
Hi there,
I’m still getting the same object ‘positive_matches’ not found error with the current code. Any suggestions? Thanks!
send me your code and I will have a look.
#Install all packages, connect to twitter API, etc.
tweets <- do.call(rbind,lapply(1:length(lats), function(i) searchTwitter('#SOTU', lang='en',n=N,since='2016-01-12',geocode=paste(lats[i],lons[i],paste0(S,'mi'),sep=','))))
tweetdate <- lapply(tweets, function(x) x$getCreated())
tweetdate <- sapply(tweetdate, function(x) strftime(x, format='%Y-%m-%d %H:%M:%S', tz='EST'))
tweettext <- unlist(tweettext)
data <- as.data.frame(cbind(tweet=tweettext,date=tweetdate))
tweet=data$tweet
tweet_list <- lapply(tweet, function(x) iconv(x, 'latin1', 'ASCII', sub=''))
tweet_list <- lapply(tweet_list, function(x) gsub('htt.*',' ',x))
tweet <- unlist(tweet_list)
data$tweet=tweet
positives <- readLines('/Users/xxxx/Downloads/opinion-lexicon-English/positive-words.txt')
negatives <- readLines('/Users/xxxx/Downloads/opinion-lexicon-English/negative-words.txt')
#Copy and pasted wrapper function from above
score <- sentiment_scores(tweet, positives, negatives, .progress= 'text')
Gives error:
Error in match(words, positive_words) :
object 'positive_matches' not found
Thanks for any help!
In your line “tweettext <- unlist(tweettext)", what is tweettext?
any update on
Error in match(words, positive_words) :
object ‘positive_matches’ not found
try with this code:
score.sentiment = function(sentences, pos.words, neg.words
, .progress = ‘none’){
scores = laply(sentences, function(sentence, pos.words, neg.words){
sentence = gsub(“[[:punct:]]”, “”, sentence)
sentence = gsub(“[[:cntrl:]]”, “”, sentence)
sentence = gsub(“\d+”, “”, sentence)
# and convert to lower case:
sentence = tolower(sentence)
# split into words. str_split is in the stringr package
word.list = str_split(sentence, “\s+”)
# sometimes a list() is one level of hierarchy too much
words = unlist(word.list)
# compare our words to the dictionaries of positive & negative terms
pos.matches = match(words, pos.words)
neg.matches = match(words, neg.words)
# match() returns the position of the matched term or NA
# we just want a TRUE/FALSE:
pos.matches = !is.na(pos.matches)
neg.matches = !is.na(neg.matches)
### we could have used “pos.matches = words %in% pos.words” to
#get the TRUE/FALSE instead of using “match() and !is.na()”
# and conveniently enough, TRUE/FALSE will be treated as 1/0 by sum():
score = sum(pos.matches) – sum(neg.matches)
return(score)
}, pos.words, neg.words, .progress = .progress )
scores.df = data.frame(score = scores, text = sentences)
return(scores.df)
}
scores = score.sentiment(tweet, positive_words,negative_words
, .progress = ‘text’)
data$score = scores
#Let’s plot a histogram of the sentiment score:
hist(scores$score, xlab = “”
, main = “Sentiment of sample tweets that have Donald Trump in them ”
, border = “black”, col = “skyblue”)
I was wondering if you managed to solve the issue above. I am running into the same trouble
Hi, really thanks for this tutorial. It is very useful for me. I am trying to run all the commands. Unfortunately, when I run
“setup_twitter_oauth(key,secret)”
I get:
Error in init_oauth1.0(self$endpoint, self$app, permission = self$params$permission) :
client error: (401) Unauthorized
Could you please explain the problem and tell me how to solve it?
Thanks in advance!
you’d need to set up a twitter dev account mate
Thanksi Could you please explain how to do it? What is the site web?
Great Show of R and Tableau. Cool insights with the sentiments.
Just a request if possible i know it would sound asking for too much: whenever some analysis is posted would it be possible to add details/comments what the codes are doing as more and more ppl are moving to R and find it quite difficult to understand just lke i did.
This suggests that very liberal zip codes in Manhattan are skewing toward positive Trump sentiment. Seems suspicious.
Thank you for your suggestion. As mentioned in the summary, to give a robust conclusion, scrapping ample size tweets is necessary. The tweets used here are a small percentage of the tweets in one week. The aim of this blog post is to show the steps, but by collecting enough size sample tweets and by using a good lexicon, we can get robust insights from social media mining.