
Hello everyone, hope you had a wonderful Christmas! In this post I will show you how to do k means clustering in R. We will use the iris dataset from the datasets library.
What is K Means Clustering?
K Means Clustering is an unsupervised learning algorithm that tries to cluster data based on their similarity. Unsupervised learning means that there is no outcome to be predicted, and the algorithm just tries to find patterns in the data. In k means clustering, we have to specify the number of clusters we want the data to be grouped into. The algorithm randomly assigns each observation to a cluster, and finds the centroid of each cluster. Then, the algorithm iterates through two steps:
- Reassign data points to the cluster whose centroid is closest.
- Calculate new centroid of each cluster.
These two steps are repeated till the within cluster variation cannot be reduced any further. The within cluster variation is calculated as the sum of the euclidean distance between the data points and their respective cluster centroids.
Exploring the data
The iris dataset contains data about sepal length, sepal width, petal length, and petal width of flowers of different species. Let us see what it looks like:
library(datasets)
head(iris)
  Sepal.Length Sepal.Width Petal.Length Petal.Width Species
1          5.1         3.5          1.4         0.2  setosa
2          4.9         3.0          1.4         0.2  setosa
3          4.7         3.2          1.3         0.2  setosa
4          4.6         3.1          1.5         0.2  setosa
5          5.0         3.6          1.4         0.2  setosa
6          5.4         3.9          1.7         0.4  setosa
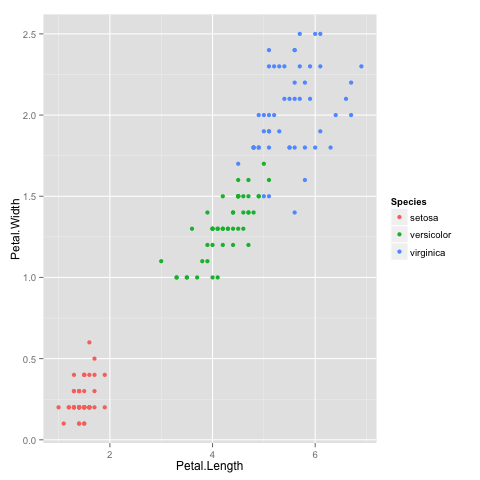
After a little bit of exploration, I found that Petal.Length and Petal.Width were similar among the same species but varied considerably between different species, as demonstrated below:
library(ggplot2)
ggplot(iris, aes(Petal.Length, Petal.Width, color = Species)) + geom_point()
Here is the plot:
Clustering
Okay, now that we have seen the data, let us try to cluster it. Since the initial cluster assignments are random, let us set the seed to ensure reproducibility.
set.seed(20)
irisCluster <- kmeans(iris[, 3:4], 3, nstart = 20)
irisCluster
K-means clustering with 3 clusters of sizes 46, 54, 50

Cluster means:
  Petal.Length Petal.Width
1     5.626087    2.047826
2     4.292593    1.359259
3     1.462000    0.246000

Clustering vector:
  [1] 3 3 3 3 3 3 3 3 3 3 3 3 3 3 3 3 3 3 3 3 3 3 3 3 3 3 3 3 3 3 3 3 3 3
 [35] 3 3 3 3 3 3 3 3 3 3 3 3 3 3 3 3 2 2 2 2 2 2 2 2 2 2 2 2 2 2 2 2 2 2
 [69] 2 2 2 2 2 2 2 2 2 1 2 2 2 2 2 1 2 2 2 2 2 2 2 2 2 2 2 2 2 2 2 2 1 1
[103] 1 1 1 1 2 1 1 1 1 1 1 1 1 1 1 1 1 2 1 1 1 2 1 1 2 2 1 1 1 1 1 1 1 1
[137] 1 1 2 1 1 1 1 1 1 1 1 1 1 1

Within cluster sum of squares by cluster:
[1] 15.16348 14.22741  2.02200
 (between_SS / total_SS =  94.3 %)

Available components:

[1] "cluster"      "centers"      "totss"        "withinss"
[5] "tot.withinss" "betweenss"    "size"         "iter"
[9] "ifault"
Since we know that there are 3 species involved, we ask the algorithm to group the data into 3 clusters, and since the starting assignments are random, we specify nstart = 20. This means that R will try 20 different random starting assignments and then select the one with the lowest within cluster variation.
We can see the cluster centroids, the clusters that each data point was assigned to, and the within cluster variation.
Let us compare the clusters with the species.
table(irisCluster$cluster, iris$Species)
    setosa versicolor virginica
  1      0          2        44
  2      0         48         6
  3     50          0         0
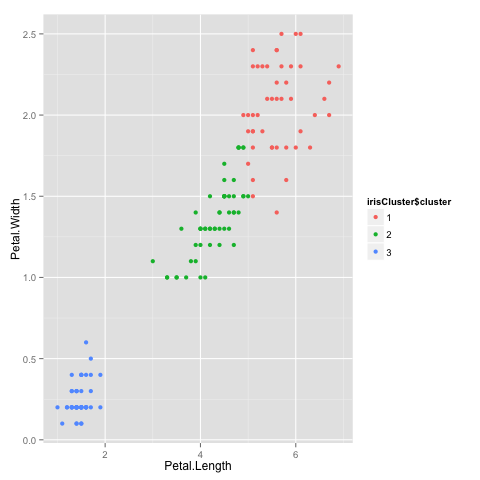
As we can see, the data belonging to the setosa species got grouped into cluster 3, versicolor into cluster 2, and virginica into cluster 1. The algorithm wrongly classified two data points belonging to versicolor and six data points belonging to virginica.
We can also plot the data to see the clusters:
irisCluster$cluster <- as.factor(irisCluster$cluster)
ggplot(iris, aes(Petal.Length, Petal.Width, color = irisCluster$cluster)) + geom_point()
Here is the plot:
That brings us to the end of the article. I hope you enjoyed it! If you have any questions or feedback, feel free to leave a comment or reach out to me on Twitter.

Can I know how to predict the cluster of new data based on the results? Thanks.
Very constructive and simple explanation. Thank you!!
can u suggest a new modified form of k-means algorithm
Can I know how well does the k-means clustering agree with the actual species information in iris$Species column ?
if i have r2<-kmeans(r1,3,7) where r2 is a variable(data set),r1 is the dataset which has the data and 3 is for no of clusters.What does 7 stands for in Kmeans using r
i am find K-Means but give different out all time if run same code.
If Use set.seed() function output is estable but this output not match with IBM software SPSS output..
Could any one help me to generate multivariate data with different clusters using R studio.
I am getting this error when trying to plot the clusters using
ggplot(iris, aes(Petal.Length, Petal.Width, color = iris$cluster)) + geom_point()
Error: Aesthetics must be either length 1 or the same as the data (150): x, y, colour
I had the same problem and noticed that the graph from the article used color = irisCluster$cluster and not color = iris$cluster … make that change and it will probably work!
Do we always need to do plotting (ggplot one) before applying k-means clustering? It may be bit time consuming to find out the pattern if there are too many variables in the input data set.
There is no such rule. It is just for understanding, u can cluster without visualizing the dataset before
In this case you know there are three cluster. But if you did not know, would you be able to recover the 3 clusters?
As far as I can see I would only recover 2 clusters if all the dots where black. ty
In
irisCluster <- kmeans(iris[, 3:4], 3, nstart = 20)
what the "iris[, 3:4]" stands for?
Take columns 3 and 4 of the iris dataset
Hi, could anyone advice me on how to pull the standard deviation value from kmeans clustering. for each particular component?
Thanks
Would you not just take the square route of the outputted Within cluster sum of squares by cluster:
[1] 15.16348 14.22741 2.02200
Could anyone tell me how you would give the misclassified datapoints in the plot give a separate color? Preferably with standard libraries in R. Thank you in advance!
I am curious as well about this!
Create a new label
data %>% mutate(correct = ifelse(reallabel == pred, “Right”, “Wrong”) %>% ggplot() blabla
Could anyone tell me how you would give the misclassified datapoints in the plot give a separate color?
Thanks for the post!
How should I deal with categorical variables, more specifically with yes/no variables?
Hey, sorry about the delay. kmeans should work just fine with categorical variables, just make sure to convert them to factor before you perform the clustering.
As a fun addition, the following should allow you to see the errors.
not.error <- unclass(iris$Species) == irisClustering$cluster
iris$noerror <- not.error
#See errors
ggplot(iris, aes(Petal.Length, Petal.Width, color = irisCluster$cluster)) +
geom_point(size = 3, alpha = 0.5, aes(shape = iris$noerror))
Cool stuff Parry!
In my opinion, the example is not good. For these data there is no reason for dividing into three clusters. Rather, the example may be seen as an illustration of the fact that the formal clustering should be complemented by other research methods.
I just wanted to show how k means clustering works, and this is a very simple example because we already know that there are 3 clusters. That being said, I completely agree with you that clustering should be complemented by other methods, like kmeans++.