There are a bunch of blogs out there posted that show how to implement apriori algorithm in R. However, when I was working on the same, I hit a roadblock since the data was neither in single format, nor in basket(Step 2 explains what a basket format is). I spent quite some time converting the data into the required format to be able to find the association rules.
So, here goes…
Step 1: Read the data
Read the ‘Groceries_dataset’ csv file. Here is a link to the csv file.
df_groceries <- read.csv("Groceries_dataset.csv")
The data consists of three columns:
Member_number: An ID that can help distinguish different purchases by different customers.
Date: The date of transaction
ItemDescription: The description of the actual item that was bought.
Step 2: Data cleaning and manipulations using R
The data required for Apriori must be in the following basket format:
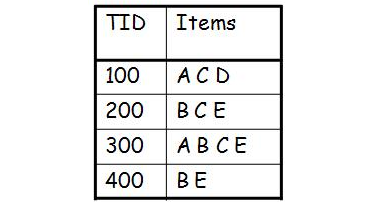
The basket format must have first column as a unique identifier of each transaction, something like a unique receipt number. The second columns consists of the items bought in that transaction, separated by spaces or commas or some other separator.
However, the data we have is something like this:
| Member number | Date | Item Description |
|---|---|---|
| 1688122020199 | 12/26/2014 | Citrus fruit |
| 1688122020199 | 10/05/2011 | Whole milk |
| 1688122020199 | 10/05/2011 | chocolates |
| 1618090368299 | 03/29/2011 | dishes |
Since the structure of the data is not in the format necessary to find association rules, we have to perform some data manipulations before finding the relationships.
Lets first make sure that the Member numbers are of numeric data type and then sort the dataframe based on the Member_number.
df_sorted <- df_groceries[order(df_groceries$Member_number),]
df_sorted$Member_number <- as.numeric(df_sorted$Member_number)
Learn more about vectors, matrices and data frames in R, or check those videos.
Now, we have to convert the dataframe into transactions format such that we have all the items bought at the same time in one row. For this, we use a function called ddply, offered by package plyr.
install.packages("plyr", dependencies= TRUE)
Make sure that you do not have package ‘dplyr’ attached to the session. You might end up getting something like this:
You have loaded plyr after dplyr - this is likely to cause problems.
If you need functions from both plyr and dplyr, please load plyr first, then dplyr:
library(plyr); library(dplyr)
Hence, detach dplyr package first and then load the package
if(sessionInfo()['basePkgs']=="dplyr" | sessionInfo()['otherPkgs']=="dplyr"){
  detach(package:dplyr, unload=TRUE)
}
library(plyr)
The next step is to actually convert the dataframe into basket format, based on the Member_number and Date of transaction
df_itemList <- ddply(df_groceries,c("Member_number","Date"),
                       function(df1)paste(df1$itemDescription,
                       collapse = ","))
The above function ddply() checks the date and member number and pivots the item descriptions with same date and same member number in one line, separated by commas.
Something like this:
| Member number | Date | Item Description |
|---|---|---|
| 1688122020199 | 12/26/2014 | Citrus fruit |
| 1688122020199 | 10/05/2011 | Whole milk |
| 1688122020199 | 10/05/2011 | chocolates |
| 1618090368299 | 03/29/2011 | dishes |
becomes:
| Member number | Date | Item Description |
|---|---|---|
| 1688122020199 | 12/26/2014 | Citrus fruit |
| 1688122020199 | 10/05/2011 | Whole milk,chocolates |
| 1618090368299 | 03/29/2011 | dishes |
Notice how member number 1688122020199 bought Whole milk and dishes on the same date; which means they were bought together. Thus we group them together in one row, separated by commas.
Thus, we now have the data in the necessary basket format. We can now implement Apriori on this data. The ddply function works pretty well even with larger datasets, I have tried it with a million rows and it takes only a few minutes to pivot the table.
Once we have the transactions, we no longer need the date and member numbers in our analysis. Go ahead and delete those columns.
df_itemList$Member_number <- NULL
df_itemList$Date <- NULL

#Rename column headers for ease of use
colnames(df_itemList) <- c("itemList")
Write the resulting table to a csv file. The reason we do this is, when we write a dataframe to a .csv file, it attaches a row number by default. (unless, of course you were to explicitly tell it not to, by using the argument “row.names=FALSE” in the write.csv function).
We can simply use these row numbers as transaction IDs, as they would be unique to each transaction. Convenient?
Write dataframe to a csv file using write.csv()
write.csv(df_itemList,"ItemList.csv", qoute = FALSE, row.names = TRUE)
Step 3: Find the association rules
Read the csv file u just saved and you will automatically get the transaction IDs in the dataframe
Run algorithm on ItemList.csv to find relationships among the items. Apriori find these relations based on the frequency of items bought together.
For implementation in R, there is a package called ‘arules’ available that provides functions to read the transactions and find association rules.
So, install and load the package:
install.packages("arules", dependencies=TRUE)
library(arules)
Using the read.transactions() functions, we can read the file ItemList.csv and convert it to a transaction format
txn = read.transactions(file="ItemList.csv", rm.duplicates= TRUE, format="basket",sep=",",cols=1);
Parameters: Transaction file: ItemList.csv
rm.duplicates : to make sure that we have no duplicate transaction entried
format : basket (row 1: transaction ids, row 2: list of items)
sep: separator between items, in this case commas
cols : column number of transaction IDs
Quotes are introduced in transactions, which are unnecessary and result in some incorrect results. So, we must get rid of them:
txn@itemInfo$labels <- gsub("\"","",txn@itemInfo$labels)
Finally, run the apriori algorithm on the transactions by specifying minimum values for support and confidence.
basket_rules <- apriori(txn,parameter = list(sup = 0.01, conf = 0.5,target="rules"));
Print the association rules. To print the association rules, we use a function called inspect(). However, if you have package ‘tm’ attached in the session, it creates a conflict with the arules package. Thus, we need to check and detach the package.
if(sessionInfo()['basePkgs']=="tm" | sessionInfo()['otherPkgs']=="tm"){
    detach(package:tm, unload=TRUE)
  }

inspect(basket_rules)

#Alternative to inspect() is to convert rules to a dataframe and then use View()
df_basket <- as(basket_rules,"data.frame")
View(df_basket)
Plot a few graphs that can help you visualize the rules. Install and load the ‘arulesViz’ library for association rules specific visualizations:
library(arulesViz)
plot(basket_rules)
plot(basket_rules, method = "grouped", control = list(k = 5))
plot(basket_rules, method="graph", control=list(type="items"))
plot(basket_rules, method="paracoord",  control=list(alpha=.5, reorder=TRUE))
plot(basket_rules,measure=c("support","lift"),shading="confidence",interactive=T)
Graph to display top 5 items
itemFrequencyPlot(txn, topN = 5)
Thats’s all Folks! I hope it was simple to understand and implement. I also have my code on githubif you dont want to type everything.
A special thanks to this blogpost, where I first learned the basics of implementing apriori in R. Also, this is my first attempt at writing a blog. Please feel free to reach out if you have any suggestions and comments.!
Thank you.


iam getting error at second line itself as $ cannot be used in atomic vectors can anyone help me out???
I have data set look like this:
https://uploads.disquscdn.com/images/d126601a47a86f451884318c0eb7f1f3dfcb736c5babb17fcab913ee3213038e.png
I run this code on it
df_itemList<- read.csv('data.3.txt')
write.csv(df_itemList,"ItemList.csv", row.names = TRUE)
txn = read.transactions(file="ItemList.csv", rm.duplicates= TRUE, format="basket",sep=",",cols=1)
basket_rules <- apriori(txn,parameter = list(sup = 0.01, conf = 0.5,target="rules"))
But it is very strange that it works and generates rules, just when the data doesn't contain more than 99 rows
Can anybody help why it doesn't work for larger data set???
basket_rules <- apriori(txn,parameter = list(sup = 0.1, conf = 0.1,target="rules")); Getting error Error in length(obj) : Method length not implemented for class rules
HI Nupur, I am facing the following error when I try to read the ItemList csv file:
“Error in read.table(file = file, header = header, sep = sep, quote = quote, :
more columns than column names”
I understand that when we were writing the itemlist into the CSV file, we did not name the transaction ID column. Can you suggest a solution for the same?
Thanks
Hello Nupur,
I have downloaded code from your repository and tried to execute it. I am using R 3.5.1. First, I had error message using the inspect() function. I worked around by commenting it out and using your alternate method. Next thing, I noticed is that none of your libray(package_name) calls used package_names in quotation marks. It gave error to me, probably due to version difference of R (3.5.1). I solved this problem by putting package_names in quotations.
Next problem I am having is at line 67 i.e
df_basket$support <- df_basket$support * nrow(df)
and the error I get is
replacement has 0 rows, data has 1186
I don't understand what df means here. This is my first script in R and printing df shows a function stub. Do you mean df_basket by df or something?
Thanks
Hi and thank you for the great tutorial!
There is a little typo in:
install.packages(“arules”, dependencies=”TRUE”)
TRUE with double quotes yields an error (no double quotes needed here).
Cheers, Peter
Hi Nupur, firstly thank you for the code. I’m facing some trouble here. When I execute ‘view(df_basket)’, it says, ‘no data available in table’. Even when I execute the apriori algorithm, i get this result ‘set item appearances …[0 item(s)] done [0.00s].’
Hi Hetansh, your output ‘set item appearances …[0 item(s)] done [0.00s].’ suggests that there were no rules generated. Have you tried lowering support and confidence values? Also, check the labels in your transaction object. Is every item unique? You can check it using
>txn@itemInfo$labels
For instance, the first line in the ItemList.csv is:
-sausage,whole milk,semi-finished bread,yogurt
When the transaction object is created, each of the items mentioned above must be a unique label. If it considers the entire line as one label, you will not get desired results.
Let me know if you run into any more problems.
Hi Nupur, I am facing the exact same problem. In my case, I think the entire line is considered as one label. What can I do to resolve the error?
Hi everyone, I am sorry for the delay in fixing the problem. I have created a new dummy dataset- “Groceries_dataset.csv”, which has more more dummy transactions than the previous dataset.
Link to the dataset: https://github.com/nupur1492/RProjects/tree/master/MarketBasketAnalysis
The other problem was, when the write.csv() command is executed, it added quotes around the list of items, thus making it a single string. I have added the qoute = FALSE parameter in write.csv. This ensures that the list of items are now distinct and separated by commas.
You can now play around with the support and confidence threshold values to control the number of rules you want.
Hope this helps. Please let me know if you run into any more issues.
Thanks!
Hi everyone, I am sorry for the delay in fixing the problem. I have created a new dummy dataset- “Groceries_dataset.csv”, which has more more dummy transactions than the previous dataset. The dataset can be found at: https://github.com/nupur1492/RProjects/tree/master/MarketBasketAnalysis
The other problem was, when the write.csv() command is executed, it adds quotes around the list of items, thus making it a single string. I have added the ‘qoute = FALSE’ parameter in write.csv. This ensures that the list of items are now distinct factors and separated by commas.
You can now play around with the support and confidence threshold values to control the number of rules you want.
Hope this helps. Please let me know if you run into any more issues.
Thanks!
Hi Nupur
I am currently working on a huge data set (3320679 rows and 3 columns). It does exactly match with your style of example mentioned above. But unfortunately the R commands doesn’t seems work. The only problem I am facing is to convert the dataset into Basket format. Is there anyone can help me with this. Thanks
Cheena
Hi Cheena,
Can you tell me the error message? or what output do you get when you run the command? I can compare with mine and be able to help you better. Thanks
Hi Nupur
I am in need of desperate help.
This is my data set with another column of patients number data. TFC codes are the speciality. This is randomly generated data not my original one. The 2 second columns indicate the days difference. I did converted them into binary but nothing happen.
TFC120 0 23/06/2008
TFC110 53 15/08/2008
TFC301 0 17/09/2007
TFC350 0 17/09/2007
TFC301 7 29/10/2007
TFC350 42 29/10/2007
TFC301 0 29/10/2007
The result are following
> rules inspect(rules)
> rules=sort(rules, by=”lift”)
>
> inspect(rules)
> rules
set of 0 rules
Hi Cheena,
I’m not sure I understand what you’re trying to analyze here. Are the TFC values some sort of IDs? and what are you trying to group it by? Is it by column 2 and 3?
Hi Nupur
Many thanks for your reply.
This is my Data set, outpatients codes, TFCcodes(speciality they are seeing) and admission date
Patient code TFC admidat
21 120 23/06/2008
21 110 15/08/2008
51 301 17/09/2007
51 350 17/09/2007
51 301 29/10/2007
51 350 29/10/2007
51 301 29/10/2007
51 350 5/11/2007
51 301 10/12/2007
82 330 30/10/2006
82 502 1/10/2007
48 104 15/01/2007
48 301 8/2/2007
91 502 25/09/2006
91 501 27/02/2007
91 501 1/4/2007
68 502 25/03/2008
Glad if you can help me out in this.
Thanks
One of the solutions could be to decrease the threshold value for support and confidence. Since the algorithms considers the frequency of a pair, sometimes small datasets yield poorer results. Hence, another option is to use it on a larger dataset.
The data that I have provided is a dummy one and so I will work on increasing the size and re-post it.
Error in plot.rules(basket_rules) : x contains 0 rules!
I ran this code on my RStudio. But basket rules was a “set of 0 rules”. I even copy pasted the code from your git hub. The same result. Any ideas why this happened
Just an update an extra comma in txn@itemInfo$labels <- gsub(""","",,txn@itemInfo$labels)
Thanks for bringing it to my notice. 🙂 Got rid of the extra comma
I get an error with txn@itemInfo$labels <- gsub(""","",,txn@itemInfo$labels), saying Error in gsub(""", "", , txn@itemInfo$labels) :
argument "x" is missing, with no default.
Pls could you tell me how to fix this?
can you suggest some of the area it can be implemented ? other than retail market store(market basket analysis), health sector
Banking sector, insurance companies, investing.
Hi Arun,
This blog provides a brief answer to your question:
http://www.salemmarafi.com/code/market-basket-analysis-with-r/
In general, association rule mining can be used in creating recommendation engines are implemented, like e-commerce, social media, search engines etc.