
Wikipedia is where a lot of people meet the standard deviation, the p-value and the t-test for the first time. I wondered whether they still do, now that "what is a p-value" can be typed into a chatbot or answered at the top of a search page. Wikimedia publishes the number of human visits to every article, month by month, so the question has a direct answer: those pages now get less than half the human readers they had four years ago, and they are losing them faster than the rest of Wikipedia.
How do I get Wikipedia pageviews into R?
Ask the Wikimedia REST API with httr2: one request per article returns monthly (or daily) view counts as JSON, and you want agent = "user" so that crawlers and bots are left out. The pageviews package that older tutorials use was archived from CRAN on 16 July 2025, so there is no wrapper to install. This block runs on its own with httr2 1.3.0 on R 4.6.1:
library(httr2)
library(tidyverse)

pageviews <- function(article, agent = "user") {
  request("https://wikimedia.org/api/rest_v1/metrics/pageviews/per-article/en.wikipedia/all-access") |>
    req_url_path_append(agent, gsub(" ", "_", article), "monthly", "2015090100", "2026083100") |>
    req_user_agent("pageviews example in R ([email protected])") |> # Wikimedia asks for a contact
    req_retry(max_tries = 5) |>                                    # waits out HTTP 429s
    req_perform() |>
    resp_body_json(simplifyVector = TRUE) |>
    pluck("items") |>
    as_tibble() |>
    transmute(article, agent, month = as.Date(timestamp, "%Y%m%d"), views)
}

pageviews("Standard deviation") |> tail(3)
## # A tibble: 3 × 4
##   article            agent month      views
##   <chr>              <chr> <date>     <int>
## 1 Standard_deviation user  2026-06-01 51656
## 2 Standard_deviation user  2026-07-01 46126
## 3 Standard_deviation user  2026-08-01 48141
Wikimedia’s User-Agent policy asks scripts to identify themselves with a contact, hence req_user_agent(). Ten requests in parallel drew HTTP 429 "Too Many Requests" for me, so fetch one article at a time; req_retry() backs off and tries again when the API pushes back.
Statistics pages against the rest of Wikipedia
I listed 45 articles that cover an introductory statistics course, from Arithmetic mean to the Mann-Whitney U test, keeping only titles that have not changed since 2015 (more on why below). For comparison I added ten school maths and science articles and ten general-interest ones, and the total for all of English Wikipedia. The comparison sets are small and hand-picked, so read them as context.
stats_pages <- c(
  "Arithmetic mean", "Median", "Mode (statistics)", "Standard deviation", "Variance",
  "Standard error", "Normal distribution", "Binomial distribution", "Poisson distribution",
  "Central limit theorem", "Confidence interval", "P-value", "Student's t-test",
  "Chi-squared test", "Analysis of variance", "Linear regression", "Regression analysis",
  "Logistic regression", "Bayes' theorem", "Law of large numbers", "Sampling (statistics)",
  "Statistical significance", "Interquartile range", "Box plot", "Histogram", "Standard score",
  "Type I and type II errors", "Probability distribution", "Percentile", "Quartile",
  "Coefficient of variation", "Skewness", "Kurtosis", "Outlier", "Simple linear regression",
  "Ordinary least squares", "Covariance", "Probability density function", "Expected value",
  "Statistics", "Descriptive statistics", "Mann–Whitney U test", "Wilcoxon signed-rank test",
  "Spearman's rank correlation coefficient", "Sample size determination")
science_pages <- c(
  "Pythagorean theorem", "Derivative", "Integral", "Logarithm", "Prime number",
  "Photosynthesis", "Mitochondrion", "Newton's laws of motion", "Periodic table", "Cell (biology)")
general_pages <- c(
  "World War II", "Albert Einstein", "United States", "Roman Empire", "The Beatles",
  "Leonardo da Vinci", "Moon", "India", "William Shakespeare", "Olympic Games")

pages <- bind_rows(
  tibble(set = "Statistics (45)", article = stats_pages),
  tibble(set = "Maths and science (10)", article = science_pages),
  tibble(set = "General interest (10)", article = general_pages))

views <- pages |>
  mutate(data = map(article, pageviews)) |>
  select(set, data) |>
  unnest(data)

# the same statistics pages, counted with every agent
stats_all_agents <- map(stats_pages, pageviews, agent = "all-agents") |>
  list_rbind() |>
  mutate(set = "Statistics (45)")

# all of English Wikipedia, one request per agent
wiki_total <- function(agent) {
  request("https://wikimedia.org/api/rest_v1/metrics/pageviews/aggregate/en.wikipedia/all-access") |>
    req_url_path_append(agent, "monthly", "2015090100", "2026083100") |>
    req_user_agent("pageviews example in R ([email protected])") |>
    req_retry(max_tries = 5) |>
    req_perform() |>
    resp_body_json(simplifyVector = TRUE) |>
    pluck("items") |>
    as_tibble() |>
    transmute(set = "All of English Wikipedia", agent, month = as.Date(timestamp, "%Y%m%d"), views)
}
wiki <- map(c("user", "all-agents", "automated"), wiki_total) |> list_rbind()
Reference pages follow the school calendar, so I add months up by school year, September to August. The 2021-22 school year is the last one that ended before ChatGPT was released on 30 November 2022.
by_year <- bind_rows(views, stats_all_agents, wiki) |>
  mutate(school_year = if_else(month(month) >= 9, year(month), year(month) - 1)) |>
  group_by(set, agent, school_year) |>
  summarise(views = sum(views), .groups = "drop")

# school years are labelled by the year they start: 2016 = 2016-17
change <- by_year |>
  filter(school_year %in% c(2016, 2021, 2025)) |>
  pivot_wider(names_from = school_year, values_from = views, names_prefix = "y") |>
  mutate(from_2016_to_2021 = y2021 / y2016 - 1, from_2021_to_2025 = y2025 / y2021 - 1)

change |>
  filter(agent == "user") |>
  select(set, from_2016_to_2021, from_2021_to_2025) |>
  mutate(across(where(is.numeric), \(x) scales::percent(x, accuracy = 1)))
## # A tibble: 4 × 3
##   set                      from_2016_to_2021 from_2021_to_2025
##   <chr>                    <chr>             <chr>
## 1 All of English Wikipedia -9%               -4%
## 2 General interest (10)    -5%               -23%
## 3 Maths and science (10)   -26%              -37%
## 4 Statistics (45)          -30%              -56%
The 45 statistics articles had 26.1 million human views in 2021-22 and 11.5 million in 2025-26, a fall of 56%. Every one of the 45 fell, 37 of them by more than half; the smallest drop was Bayes’ theorem (27%), the largest Descriptive statistics (79%). Over the same four years the maths and science pages lost 37%, the general-interest pages 23%, and English Wikipedia as a whole 4%.
dsp_colors <- c("#0066CC", "#E8862D", "#159A6C", "#7D5BD6",
                "#D64580", "#2AA9B8", "#C9A227")
dsp_theme <- theme_minimal(base_size = 13) +
  theme(plot.background    = element_rect(fill = "#ECECEF", color = NA),
        panel.background   = element_rect(fill = "#ECECEF", color = NA),
        panel.grid.minor   = element_blank(),
        panel.grid.major.x = element_blank(),
        panel.grid.major.y = element_line(color = "grey78"),
        axis.ticks         = element_blank(),
        plot.title         = element_text(face = "bold"),
        strip.text         = element_text(face = "bold"))

indexed <- by_year |>
  filter(agent == "user") |>
  group_by(set) |>
  mutate(index = 100 * views / views[school_year == 2016]) |>
  ungroup()

ggplot(indexed, aes(school_year, index, color = set)) +
  geom_vline(xintercept = 2021.5, linetype = "dashed", color = "grey50") +
  annotate("text", x = 2021.6, y = 138, label = "ChatGPT released\nNov 2022",
           hjust = 0, size = 3.4, color = "grey35", lineheight = 0.9) +
  geom_line(linewidth = 1) +
  geom_point(size = 1.8) +
  geom_text(data = filter(indexed, school_year == 2025), aes(label = set),
            hjust = 0, nudge_x = 0.2, size = 3.6) +
  scale_color_manual(values = dsp_colors[c(4, 3, 2, 1)]) +
  scale_x_continuous(breaks = seq(2015, 2025, 2),
                     labels = \(x) paste0(x, "-", substr(x + 1, 3, 4)),
                     expand = expansion(mult = c(0.02, 0.33))) +
  scale_y_continuous(limits = c(0, NA)) +
  labs(x = "School year (September to August)", y = "Human pageviews, 2016-17 = 100",
       title = "Statistics pages lost readers fastest") +
  dsp_theme +
  theme(legend.position = "none")
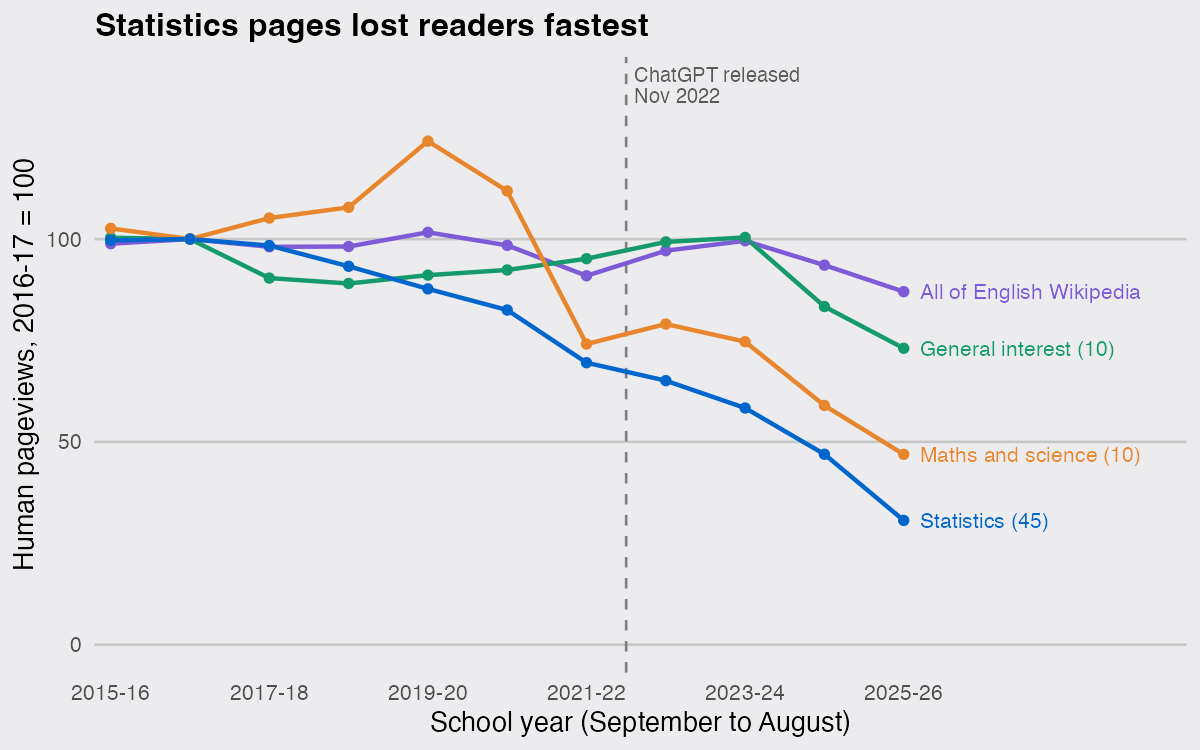
The statistics pages were already slipping before 2022: they lost 30% between 2016-17 and 2021-22, while the general-interest pages lost 5%. What changed is the pace. That five-year loss works out to about 7% a year; the four years since average 19%, and the latest year is the steepest, with every month from September 2025 to August 2026 between 27% and 42% below the same month a year earlier.
Should I use "user" or "all-agents" in the Wikipedia API?
Use user if you want people. The API splits traffic into user, spider (crawlers that say they are crawlers) and automated (bots that Wikimedia’s detection catches anyway), and all-agents is the sum of all three. The archived pageviews package defaulted to user_type = "all", which it sends to the API as all-agents, so code written against it counts bots unless someone changed the argument.
On these data the choice changes the answer:
change |>
  filter(set %in% c("Statistics (45)", "All of English Wikipedia")) |>
  select(set, agent, from_2021_to_2025) |>
  mutate(from_2021_to_2025 = scales::percent(from_2021_to_2025, accuracy = 1))
## # A tibble: 5 × 3
##   set                      agent      from_2021_to_2025
##   <chr>                    <chr>      <chr>
## 1 All of English Wikipedia all-agents 9%
## 2 All of English Wikipedia automated  162%
## 3 All of English Wikipedia user       -4%
## 4 Statistics (45)          all-agents -47%
## 5 Statistics (45)          user       -56%
Counted with all-agents, English Wikipedia grew 9% between 2021-22 and 2025-26; counted as people, it shrank 4%. The difference is automated traffic, which went from 8.3 billion to 21.8 billion views a year. For the statistics pages the sign survives, but the loss shrinks from 56% to 47%. The labels are Wikimedia’s classification, and it moves as their bot detection improves, so treat user as their best current estimate rather than a census of humans.
Renamed articles break a pageview series
The API counts views for the exact title you ask for. When an article is renamed, readers move to the new title and the old one keeps only stray links, so a single-title series shows a cliff on one side and a jump on the other. That is why three pages are missing from my list: Correlation (called "Correlation and dependence" until 2021), Pearson correlation coefficient (renamed in January 2017) and Statistical hypothesis test (renamed in 2024).
correlation <- map(c("Correlation", "Correlation and dependence"), pageviews) |>
  list_rbind() |>
  mutate(school_year = if_else(month(month) >= 9, year(month), year(month) - 1)) |>
  filter(school_year %in% c(2016, 2025)) |>
  group_by(school_year) |>
  summarise(new_title_only = sum(views[article == "Correlation"]),
            both_titles = sum(views))
correlation
## # A tibble: 2 × 3
##   school_year new_title_only both_titles
##         <dbl>          <int>       <int>
## 1        2016         117019      778810
## 2        2025         181875      197149
On its current title alone, Correlation would be the only statistics page in this post that grew, up 55% since 2016-17. Adding the old title back shows it fell 75%, in line with the rest. Before trusting a long series, look for a month where views jump or collapse by a factor of three or more, and check the article’s move log.
What the numbers say and what they do not
Human visits to Wikipedia’s core statistics articles fell from 37.5 million in 2016-17 to 11.5 million in 2025-26, less than a third of what they were, and since 2022 they have fallen faster than any comparison set. Pageviews cannot say why. The timing fits readers getting definitions and worked examples from AI assistants and from AI summaries in search results, and the earlier slide fits search engines answering short questions on the results page, but a view count does not record where a reader went instead. Nor does it mean fewer people are learning statistics, only that fewer of them are doing it on Wikipedia.
