
Hurricane Melissa peaked at 165-knot winds (about 190 mph) on 28 October 2025, hours before it came ashore in Jamaica. It was the third Category 5 of a season that produced only 5 hurricanes. Seasons like that make the top of the Atlantic scale look crowded, and I wanted to check whether it is, against the record itself.
The record is NOAA’s HURDAT2, the National Hurricane Center’s best-track database: every Atlantic tropical cyclone since 1851, with position, maximum wind and central pressure every six hours. It is free, public domain, and one plain-text file. It is not a CSV, though, and the way it codes missing values can reverse a trend if you read it carelessly.
How do I read NOAA’s HURDAT2 hurricane file into R?
Read it as plain lines, flag the header lines that start with a storm ID, use cumsum() on that flag to carry each storm down onto its track lines, and split the track lines on commas. Each storm in the file is one header line such as AL132025, MELISSA, 49, followed by its 49 track lines (date, time, record type, status, latitude, longitude, maximum sustained wind in knots, minimum pressure in hPa, then wind radii). This block runs on its own with tidyverse 2.0 (tidyr 1.3 or later):
library(tidyverse)

url <- "https://www.nhc.noaa.gov/data/hurdat/hurdat2-1851-2025-092326.txt"

hurdat <- tibble(line = read_lines(url)) |>
  mutate(header = str_detect(line, "^AL\\d{6},"),
         storm  = cumsum(header))

storms <- hurdat |>
  filter(header) |>
  separate_wider_delim(line, ",", names = c("id", "name", "rows", NA)) |>
  mutate(across(c(id, name), str_trim)) |>
  select(storm, id, name)

track <- hurdat |>
  filter(!header) |>
  separate_wider_delim(line, ",", too_many = "drop",
                       names = c("date", "time", "record", "status",
                                 "lat", "lon", "wind", "pressure")) |>
  mutate(across(date:pressure, str_trim),
         when     = ymd_hm(str_c(date, time)),
         year     = year(when),
         lat      = parse_number(lat) * if_else(str_ends(lat, "S"), -1, 1),
         lon      = parse_number(lon) * if_else(str_ends(lon, "W"), -1, 1),
         wind     = na_if(as.integer(wind), -99),
         pressure = na_if(as.integer(pressure), -999)) |>
  left_join(storms, by = "storm") |>
  select(id, name, when, year, record, status, lat, lon, wind, pressure)

track |>
  filter(name == "MELISSA", year == 2025, wind >= 150) |>
  select(name, when, record, status, lat, lon, wind, pressure)
## # A tibble: 5 × 8
##   name    when                record status   lat   lon  wind pressure
##   <chr>   <dttm>              <chr>  <chr>  <dbl> <dbl> <int>    <int>
## 1 MELISSA 2025-10-27 18:00:00 ""     HU      16.4 -78.3   155      906
## 2 MELISSA 2025-10-28 00:00:00 ""     HU      16.5 -78.6   155      909
## 3 MELISSA 2025-10-28 06:00:00 ""     HU      16.9 -78.4   155      900
## 4 MELISSA 2025-10-28 12:00:00 ""     HU      17.5 -78.1   165      892
## 5 MELISSA 2025-10-28 17:25:00 "L"    HU      18.1 -78     160      897
That gives 55,524 track points for 1,988 systems, depressions included. The file name carries its release date; this is the September 2026 version, which covers seasons through 2025. Missing winds are coded -99 and missing pressures -999, and the two na_if() lines turn them into NA. That last step is not cosmetic, as the final section shows.
Thirteen Category 5s in ten seasons
A hurricane is Category 5 when its sustained wind reaches 137 knots (157 mph). The file stores wind in 5-knot steps, so the first Category 5 value is 140. I take each storm’s peak wind while it had hurricane status, then count Category 5s over every run of ten consecutive seasons:
hurricanes <- track |>
  filter(status == "HU") |>
  summarise(peak = max(wind), .by = c(id, name, year))

ten_season <- hurricanes |>
  count(year, wt = peak >= 137, name = "cat5") |>
  complete(year = 1851:2025, fill = list(cat5 = 0)) |>
  mutate(cat5 = cumsum(cat5) - lag(cumsum(cat5), 10, default = 0)) |>
  filter(year >= 1860) |>
  rename(last_year = year)

ten_season |> slice_max(cat5, n = 3)
## # A tibble: 3 × 2
##   last_year  cat5
##       <dbl> <int>
## 1      2025    13
## 2      2024    10
## 3      2007     9
The record holds 44 Category 5 hurricanes since 1851, and 13 of them, 30%, came in the ten seasons from 2016 to 2025. The busiest ten-season stretch before that, 1998 to 2007, had 9. Melissa’s 165 knots tie Allen (1980) for the highest wind in the file, and its 892 hPa is the lowest pressure since Wilma in 2005.
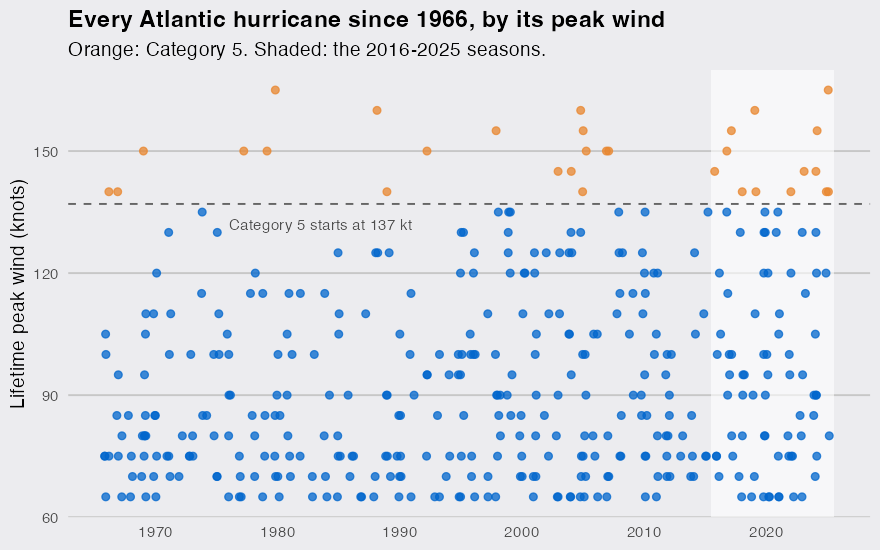
More hurricanes alone would not explain it. Routine satellite coverage starts in the mid-1960s, so I compare three eras from 1966:
era_of <- \(year) case_when(year <= 1995 ~ "1966-1995",
                            year <= 2015 ~ "1996-2015",
                            .default     = "2016-2025")

eras <- hurricanes |>
  filter(year >= 1966) |>
  mutate(era = era_of(year)) |>
  summarise(per_season    = n() / n_distinct(year),
            cat5          = sum(peak >= 137),
            cat5_share    = mean(peak >= 137),
            major_to_cat5 = sum(peak >= 137) / sum(peak >= 96),
            at_130kt      = mean(peak >= 130),
            .by = era)
eras
## # A tibble: 3 × 6
##   era       per_season  cat5 cat5_share major_to_cat5 at_130kt
##   <chr>          <dbl> <int>      <dbl>         <dbl>    <dbl>
## 1 1966-1995       5.57     9     0.0539         0.170   0.0838
## 2 1996-2015       7.25     9     0.0621         0.136   0.124
## 3 2016-2025       8.4     13     0.155          0.317   0.262
The 1996-2015 seasons were already busier than 1966-1995 (7.25 hurricanes a season against 5.57), yet the share reaching Category 5 barely moved, 5.4% to 6.2%. Since 2016 it is 15.5%, and a hurricane that became a major (96 knots or more) went on to Category 5 32% of the time, against 14% in 1996-2015. It is not a 5-knot artifact at the line: the share of hurricanes peaking at 130 knots or more went from 12% to 26%.
Why does -999 in HURDAT2 reverse a pressure trend?
Because -999 is lower than any real pressure, so if you leave the code in, every hurricane with a single missing reading counts as one of the deepest storms ever measured. Central pressure is a second measure of intensity (when aircraft fly into a storm, it is the one they measure most directly), so I counted hurricanes that fell below 920 hPa, once with the codes the file actually holds and once with NA:
deep <- track |>
  filter(status == "HU", year >= 1966) |>
  mutate(era      = era_of(year),
         as_coded = coalesce(pressure, -999L)) |>
  summarise(naive = any(as_coded < 920),
            fixed = any(pressure < 920, na.rm = TRUE),
            gaps  = anyNA(pressure),
            .by = c(id, era)) |>
  summarise(hurricanes      = n(),
            with_gaps       = sum(gaps),
            below_920_naive = sum(naive),
            below_920       = sum(fixed),
            .by = era)
deep
## # A tibble: 3 × 5
##   era       hurricanes with_gaps below_920_naive below_920
##   <chr>          <int>     <int>           <int>     <int>
## 1 1966-1995        167        53              57         5
## 2 1996-2015        145         0               7         7
## 3 2016-2025         84         0               9         9
Read naively, sub-920 hurricanes collapse from 57 in 1966-1995 to 9 in 2016-2025, the opposite of what happened. With NA the counts are 5, 7 and 9. The first of those is a floor, since 53 of that era’s 167 hurricanes have pressure gaps, but the two later eras are complete: the share of hurricanes deeper than 920 hPa went from 4.8% to 10.7%, the same direction as the wind.
What the count can and cannot say
These are small numbers, and the file shows how lumpy they are: the 8 seasons from 2008 to 2015 produced no Category 5 at all. Observation matters at the margin too. Two of the 13 storms, Michael (2018) and Lorenzo (2019), reach 140 knots only in an extra record between the standard six-hourly times; counting the four standard times alone leaves 11, still more than any earlier ten seasons. What the record does show, with two measures pointing the same way, is that since 2016 the hurricanes that form have been reaching the top of the scale far more often than in any earlier stretch of the satellite era. Why is a different question, and this file alone cannot settle it.
