
Spain won the 2026 World Cup beating Argentina 1–0 with a Ferran Torres goal in the 106th minute. Ninety scoreless minutes, then a champion crowned in extra time — which raises a question: is that how World Cup finals usually go, or did we just watch an unusual one? A single match can’t say — but the full record can: in what minute is the decisive goal typically scored, and has that minute drifted later over the tournament’s history? To answer, we need every goal ever scored in a final with the minute it was scored — exactly what the open international football results dataset ↗ maintained by Mart Jürisoo provides: every international match since 1872, every goal, every minute, with last night’s final already in it. Two charts will give the answer — first the full picture, all 23 finals on one timeline, then the winning goal on its own.
R packages needed for this project:
library(ggplot2)
library(dplyr)
library(rvest)
library(ggrepel)
library(ggtext)
The data
Two CSVs: one row per match, and one row per goal (scorer, minute, penalty and own-goal flags).
base    <- "https://raw.githubusercontent.com/martj42/international_results/master/"
results <- read.csv(paste0(base, "results.csv"))
goals   <- read.csv(paste0(base, "goalscorers.csv"))
The dataset doesn’t label which match is a final, so we need a list of the 23 finals from somewhere. Rather than typing it by hand, we scrape it from Wikipedia’s list of World Cup finals ↗: rvest reads the page, html_table() converts its tables, and we keep the one with a Winners column. Everything we need is in it — including whether the final went to extra time or penalties, which we parse out of the Score column. One cleaning step is genuinely necessary: Wikipedia correctly says West Germany for 1954–1990, but the results dataset uses Germany throughout, and the names must agree for the join ahead.
page <- read_html("https://en.wikipedia.org/wiki/List_of_FIFA_World_Cup_finals")
tabs <- html_table(page, fill = TRUE)
wiki <- tabs[[which(sapply(tabs, function(t) "Winners" %in% names(t)))[1]]]

finals <- wiki %>%
  transmute(year   = as.integer(Year),
            winner = sub("West Germany", "Germany", Winners),
            loser  = sub("West Germany", "Germany", `Runners-up`),
            et     = grepl("a.e.t.", Score, fixed = TRUE),
            pens   = grepl("pen.",   Score, fixed = TRUE),
            pens_score = ifelse(pens, sub(".*\((\d+–\d+) pen.*", "\1", Score), NA)) %>%
  filter(!is.na(year))
nrow(finals)
## [1] 23
Now we find each final in the results data. Wikipedia’s table has no match date, only the year — and there are two traps waiting. First, finals are played at neutral venues, so the dataset’s home_team/away_team is just an arbitrary listing order: we must match the two finalists in either order. Second, matching a year and a team pair is not always unique, because sometimes the finalists had already met earlier in the same tournament — in 1954 Hungary beat West Germany 8–3 in the group stage before losing the final to them, and 1962 has a group-stage Brazil–Czechoslovakia too. The pair’s last meeting of the tournament is always the final, so slice_max(date) resolves it. (This also sidesteps a third trap we never trigger: in 1938 the final and the third-place match were played on the same day, so date alone wouldn’t identify the final either.) A final join pulls in every goal from those 23 matches, tagged by which side scored it and how.
wc <- results %>%
  filter(tournament == "FIFA World Cup") %>%
  mutate(year = as.integer(substr(date, 1, 4)))

finals <- finals %>%
  left_join(wc, by = "year", relationship = "many-to-many") %>%
  filter((home_team == winner & away_team == loser) |
         (home_team == loser  & away_team == winner)) %>%
  group_by(year) %>% slice_max(date, n = 1) %>% ungroup()

fgoals <- goals %>%
  inner_join(finals, by = c("date", "home_team", "away_team")) %>%
  mutate(side = ifelse(team == winner, "Winning team", "Losing team"),
         kind = case_when(own_goal == "TRUE" ~ "Own goal",
                          penalty  == "TRUE" ~ "Penalty",
                          TRUE               ~ "Open play"))
nrow(fgoals)
## [1] 84
84 goals in 96 years of finals. A shared minimal theme keeps the two figures consistent:
th <- theme_minimal(base_size = 12) +
  theme(panel.grid.minor = element_blank(),
        plot.title = element_text(face = "bold", size = 15),
        plot.subtitle = element_text(colour = "#52514e", size = 10.5,
                                     margin = margin(b = 10)),
        plot.caption = element_text(colour = "#8a8983", size = 8.5, hjust = 0),
        plot.tag = element_text(colour = "#8a8983", size = 8.5,
                                hjust = 1, vjust = 0),
        plot.tag.position = c(1, 0), plot.tag.location = "plot",
        legend.position = "top", legend.justification = "left")
WIN <- "#2a78d6"; LOSE <- "#b9b8b2"; ACC <- "#e34948"
Figure 1: all 23 finals on one chart
Each final is a horizontal strip from kick-off to full time (extended to 120′ where extra time was played), and each goal sits on it at the minute it was scored — winners in blue, losers in gray, penalties as diamonds, own goals as squares. The result labels keep the dataset’s original team order (its nominal home/away listing — finals are at neutral venues), with the winner in blue; aet means the final was decided after extra time, and where it says pens the match was still level after 120 minutes, so the winner came from a penalty shootout — the shootout score is in parentheses.
strips <- finals %>% mutate(xmax = ifelse(et, 120, 90))
labels <- finals %>%
  mutate(suffix = case_when(
           pens ~ paste0(" (", pens_score, " pens)"),
           et   ~ " aet",
           TRUE ~ ""),
         lab = paste0(ifelse(home_team == winner,
                             paste0("<b style='color:#2a78d6'>", home_team, "</b>"),
                             home_team),
                      " ", home_score, "–", away_score, " ",
                      ifelse(away_team == winner,
                             paste0("<b style='color:#2a78d6'>", away_team, "</b>"),
                             away_team),
                      suffix))

ggplot() +
  annotate("rect", xmin = 90, xmax = 120, ymin = -Inf, ymax = Inf, fill = "#f3f2ef") +
  geom_segment(data = strips,
               aes(x = 0, xend = xmax, y = factor(year), yend = factor(year)),
               colour = "#e3e2de", linewidth = 2.6, lineend = "round") +
  geom_point(data = fgoals, aes(minute, factor(year), fill = side, shape = kind),
             size = 3, colour = "white", stroke = 0.5) +
  geom_richtext(data = labels, aes(x = 126, y = factor(year), label = lab),
                hjust = 0, size = 2.9, colour = "#52514e",
                fill = NA, label.colour = NA, label.padding = unit(0, "pt")) +
  scale_fill_manual(NULL, values = c("Winning team" = WIN, "Losing team" = LOSE)) +
  scale_shape_manual(NULL, values = c("Open play" = 21, "Penalty" = 23, "Own goal" = 22)) +
  scale_x_continuous(breaks = seq(0, 120, 15), limits = c(0, 205), expand = c(0.01, 0)) +
  scale_y_discrete(limits = rev(as.character(finals$year))) +
  guides(fill = guide_legend(override.aes = list(shape = 21, size = 3.4)),
         shape = guide_legend(override.aes = list(fill = "#8a8983", size = 3.4))) +
  labs(title = "Every goal ever scored in a World Cup final",
       subtitle = "23 finals, 1930–2026 · each dot is a goal at the minute it was scored · shaded band = extra time",
       x = "Match minute", y = NULL,
       caption = "Teams in the dataset's original order, winner in blue · aet = decided after extra time · pens = level after 120', decided by penalty shootout (shootout score in parentheses).n1994 is blank: the only 0–0 final. Data: github.com/martj42/international_results · finals list: Wikipedia",
       tag = "datascienceplus.com") +
  th + theme(panel.grid.major.y = element_blank(),
             axis.text.y = element_text(colour = "#0b0b0b", face = "bold", size = 9.5))
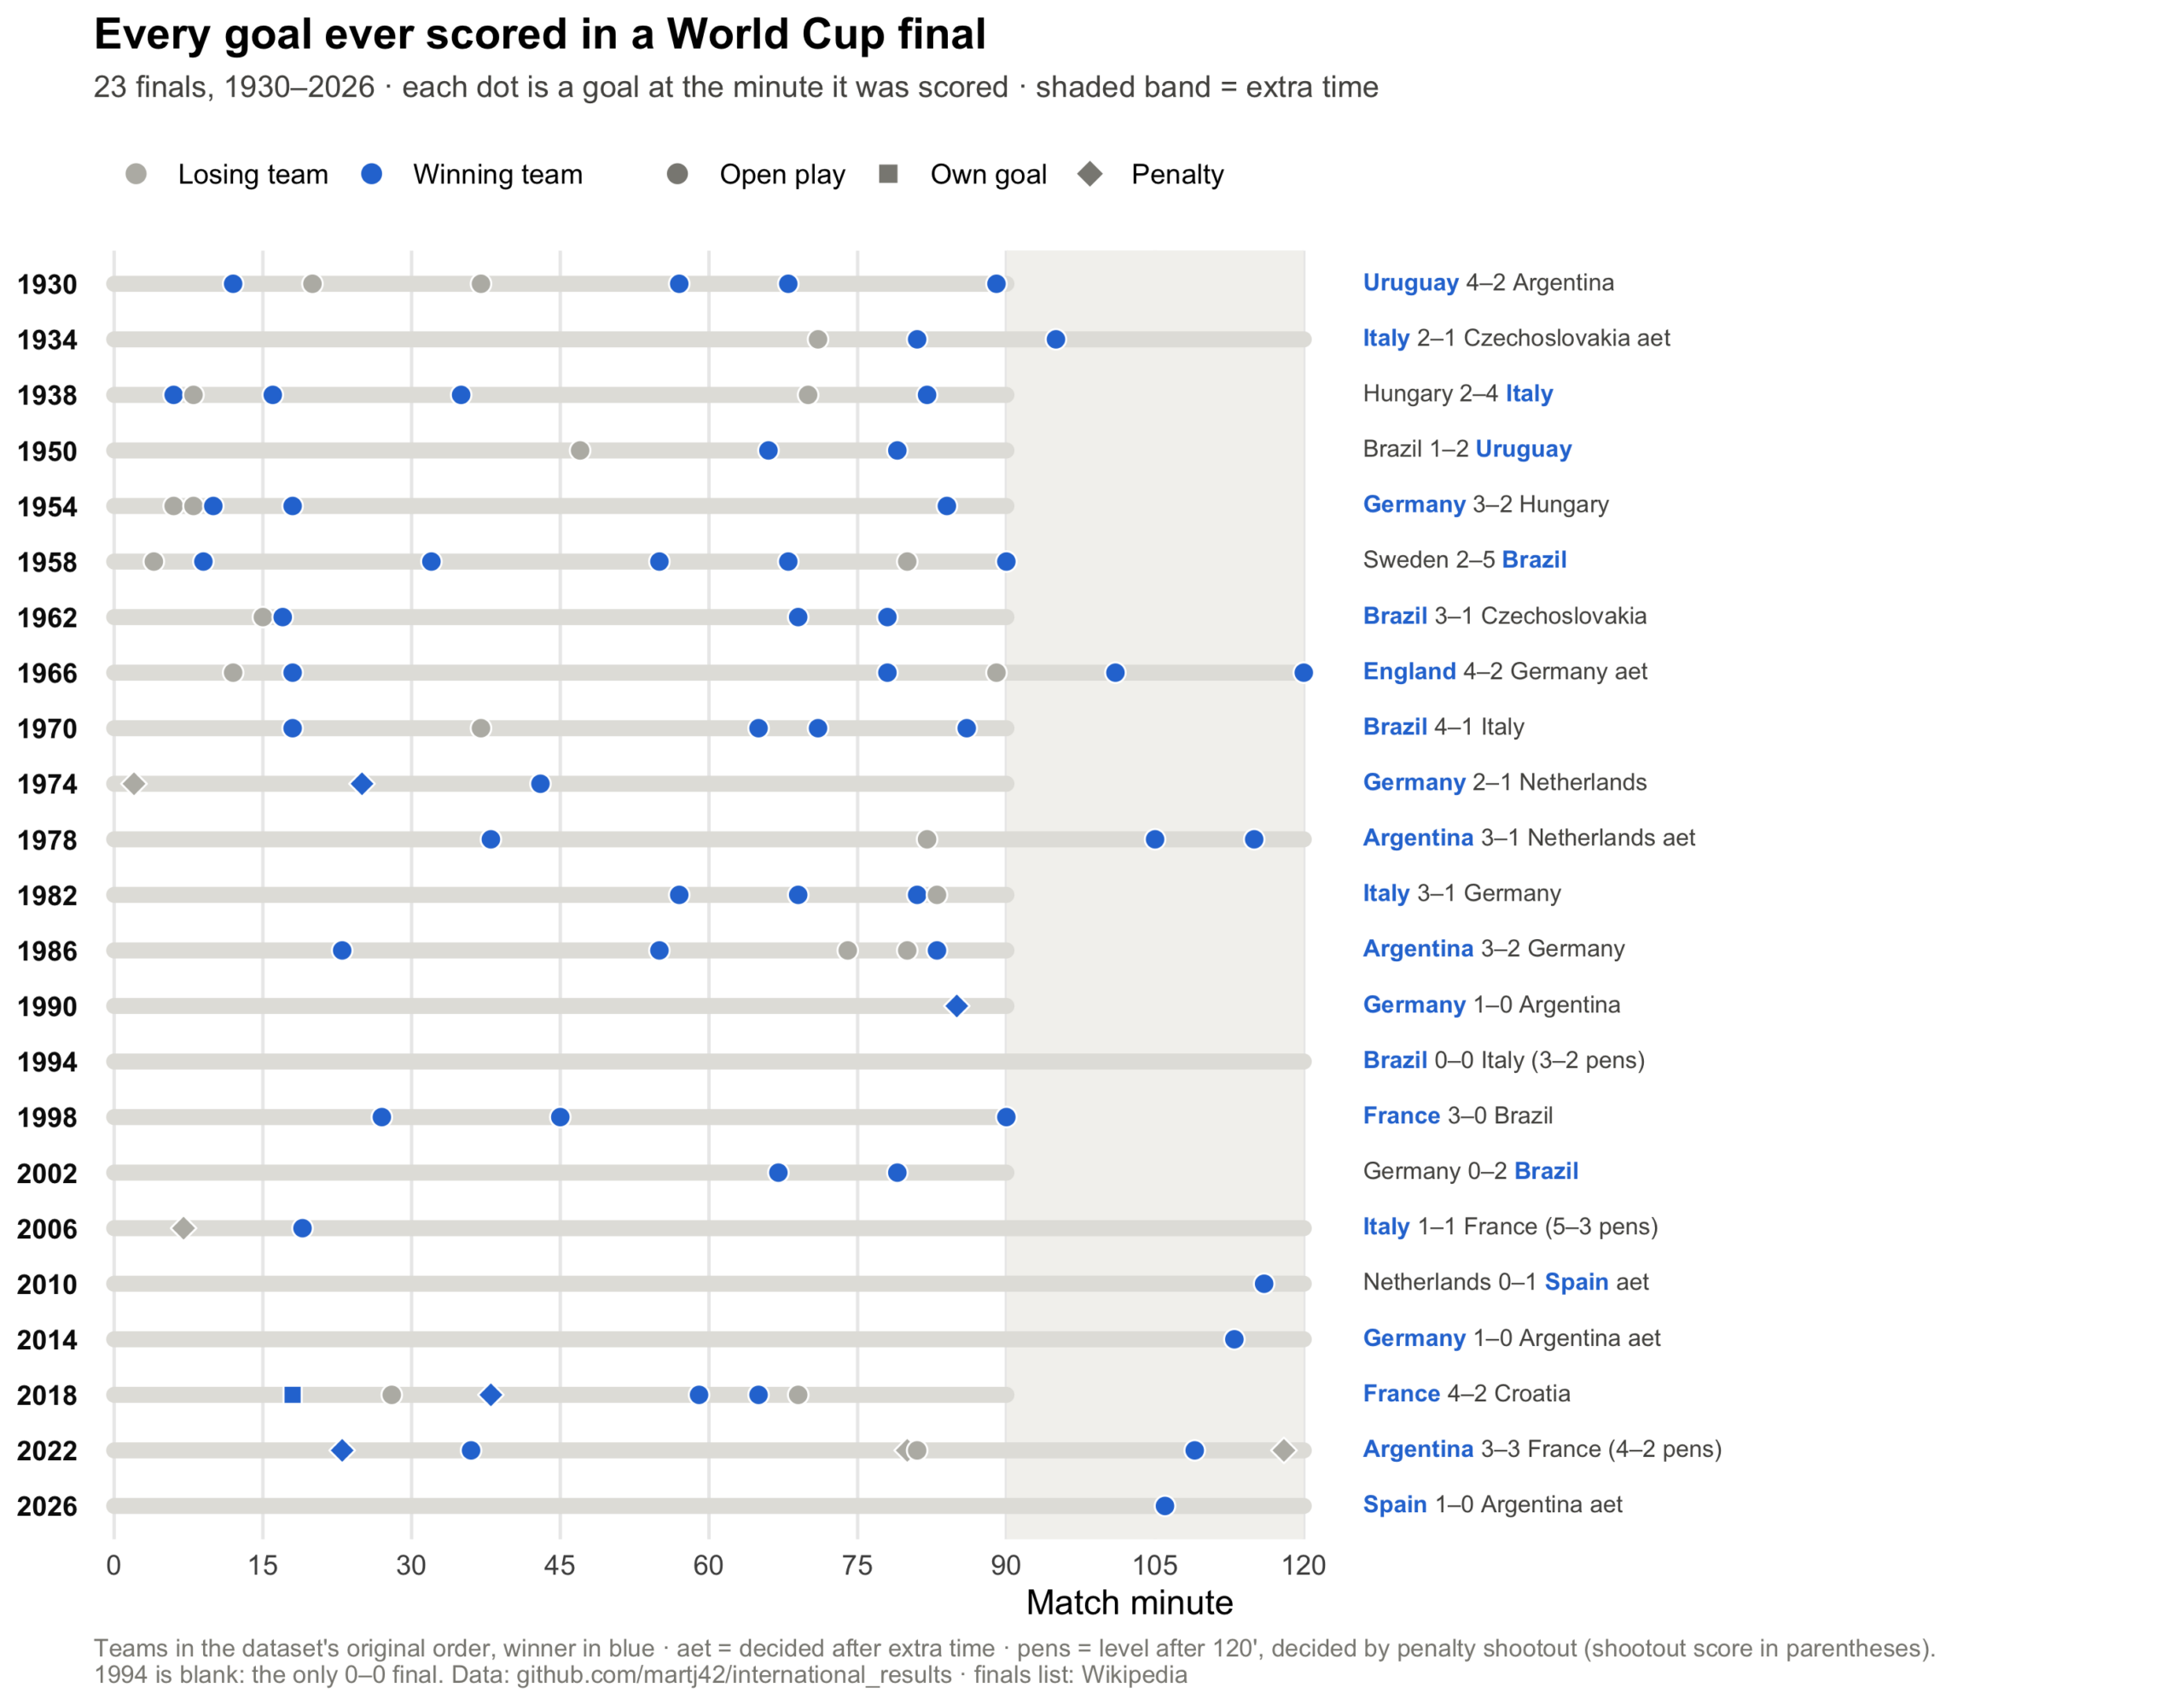
Whole eras are readable at a glance. The top third is the goal-fest period — Brazil’s 5–2 in 1958 made seven goals in a final, still the record. Then the chart empties out: from 1990 to 2014, four of seven finals produced one goal or none, with 1994 the only strip with no dot at all. And the recent finals push right: 2010, 2014, and 2026 were all settled inside the shaded extra-time band.
Figure 2: the winning goal keeps coming later
That rightward drift is worth isolating. Define the winning goal as the goal that put the champion ahead for good — the champion’s (opponent’s score + 1)th goal. In a 4–2 that’s the winner’s third goal; in a 1–0 it’s the only one. Sorting each champion’s goals by minute and picking that one is three lines of dplyr:
decisive <- fgoals %>%
  filter(team == winner) %>%
  group_by(year) %>% arrange(minute, .by_group = TRUE) %>%
  mutate(n_goal = row_number()) %>%
  left_join(finals %>% transmute(year, need = pmin(home_score, away_score) + 1),
            by = "year") %>%
  filter(n_goal == need) %>%
  ungroup() %>% select(year, minute, scorer)

shootout_finals <- finals %>% filter(pens) %>%
  transmute(year, minute = 126, scorer = "penalties")
dec  <- bind_rows(decisive, shootout_finals) %>% arrange(year)
The three shootout finals have no winning goal, so they get parked above the 120-minute line as a separate mark. Every matchup is written vertically inside the plot (in the dataset’s original team order, winner in blue), rising from the baseline under its dot, and a loess curve traces the century-long trend.
callouts <- dec %>%
  filter(year %in% c(1930, 1966, 2010, 2014, 2026)) %>%
  mutate(lab = paste0(scorer, " ", minute, "'"))

matchups <- dec %>%
  left_join(finals %>% select(year, winner, home_team, away_team), by = "year") %>%
  mutate(lab = paste0(ifelse(home_team == winner,
                             paste0("<b style='color:#2a78d6'>", home_team, "</b>"),
                             home_team),
                      " v ",
                      ifelse(away_team == winner,
                             paste0("<b style='color:#2a78d6'>", away_team, "</b>"),
                             away_team)))

ggplot(dec, aes(year, minute)) +
  annotate("rect", ymin = 90, ymax = 120, xmin = -Inf, xmax = Inf, fill = "#f3f2ef") +
  annotate("text", x = 1931, y = 116, label = "extra time", hjust = 0,
           size = 3.1, colour = "#8a8983", fontface = "italic") +
  geom_smooth(data = dec %>% filter(minute <= 120), method = "loess", span = 1.1,
              se = FALSE, colour = "#a9c7ec", linewidth = 1.1) +
  geom_richtext(data = matchups, aes(x = year, y = 2, label = lab),
                angle = 90, hjust = 0, size = 2.5, colour = "#a5a49e",
                fill = NA, label.colour = NA, label.padding = unit(0, "pt")) +
  geom_point(aes(fill = minute > 120), shape = 21, size = 3.4,
             colour = "white", stroke = 0.5, show.legend = FALSE) +
  geom_text_repel(data = callouts, aes(label = lab), size = 3,
                  colour = "#52514e", seed = 3, box.padding = 0.5,
                  min.segment.length = 0.3, segment.colour = "#c9c8c2") +
  annotate("text", x = 1994, y = 129, label = "decided on penalties",
           size = 3, colour = ACC, fontface = "italic") +
  scale_fill_manual(values = c(`FALSE` = WIN, `TRUE` = ACC)) +
  scale_y_continuous(breaks = seq(0, 120, 30), limits = c(0, 132)) +
  scale_x_continuous(breaks = seq(1930, 2026, 16)) +
  labs(title = "The goal that wins the World Cup keeps coming later",
       subtitle = "Minute of the match-winning goal in each final (the goal that put the champion ahead for good)",
       x = NULL, y = "Minute of the winning goal",
       caption = "Winning goal = the champion's (opponent's score + 1)th goal. Three finals had none — settled from the spot.nVertical matchup labels keep the dataset's team order, winner in blue. Data: github.com/martj42/international_results · finals list: Wikipedia",
       tag = "datascienceplus.com") +
  th
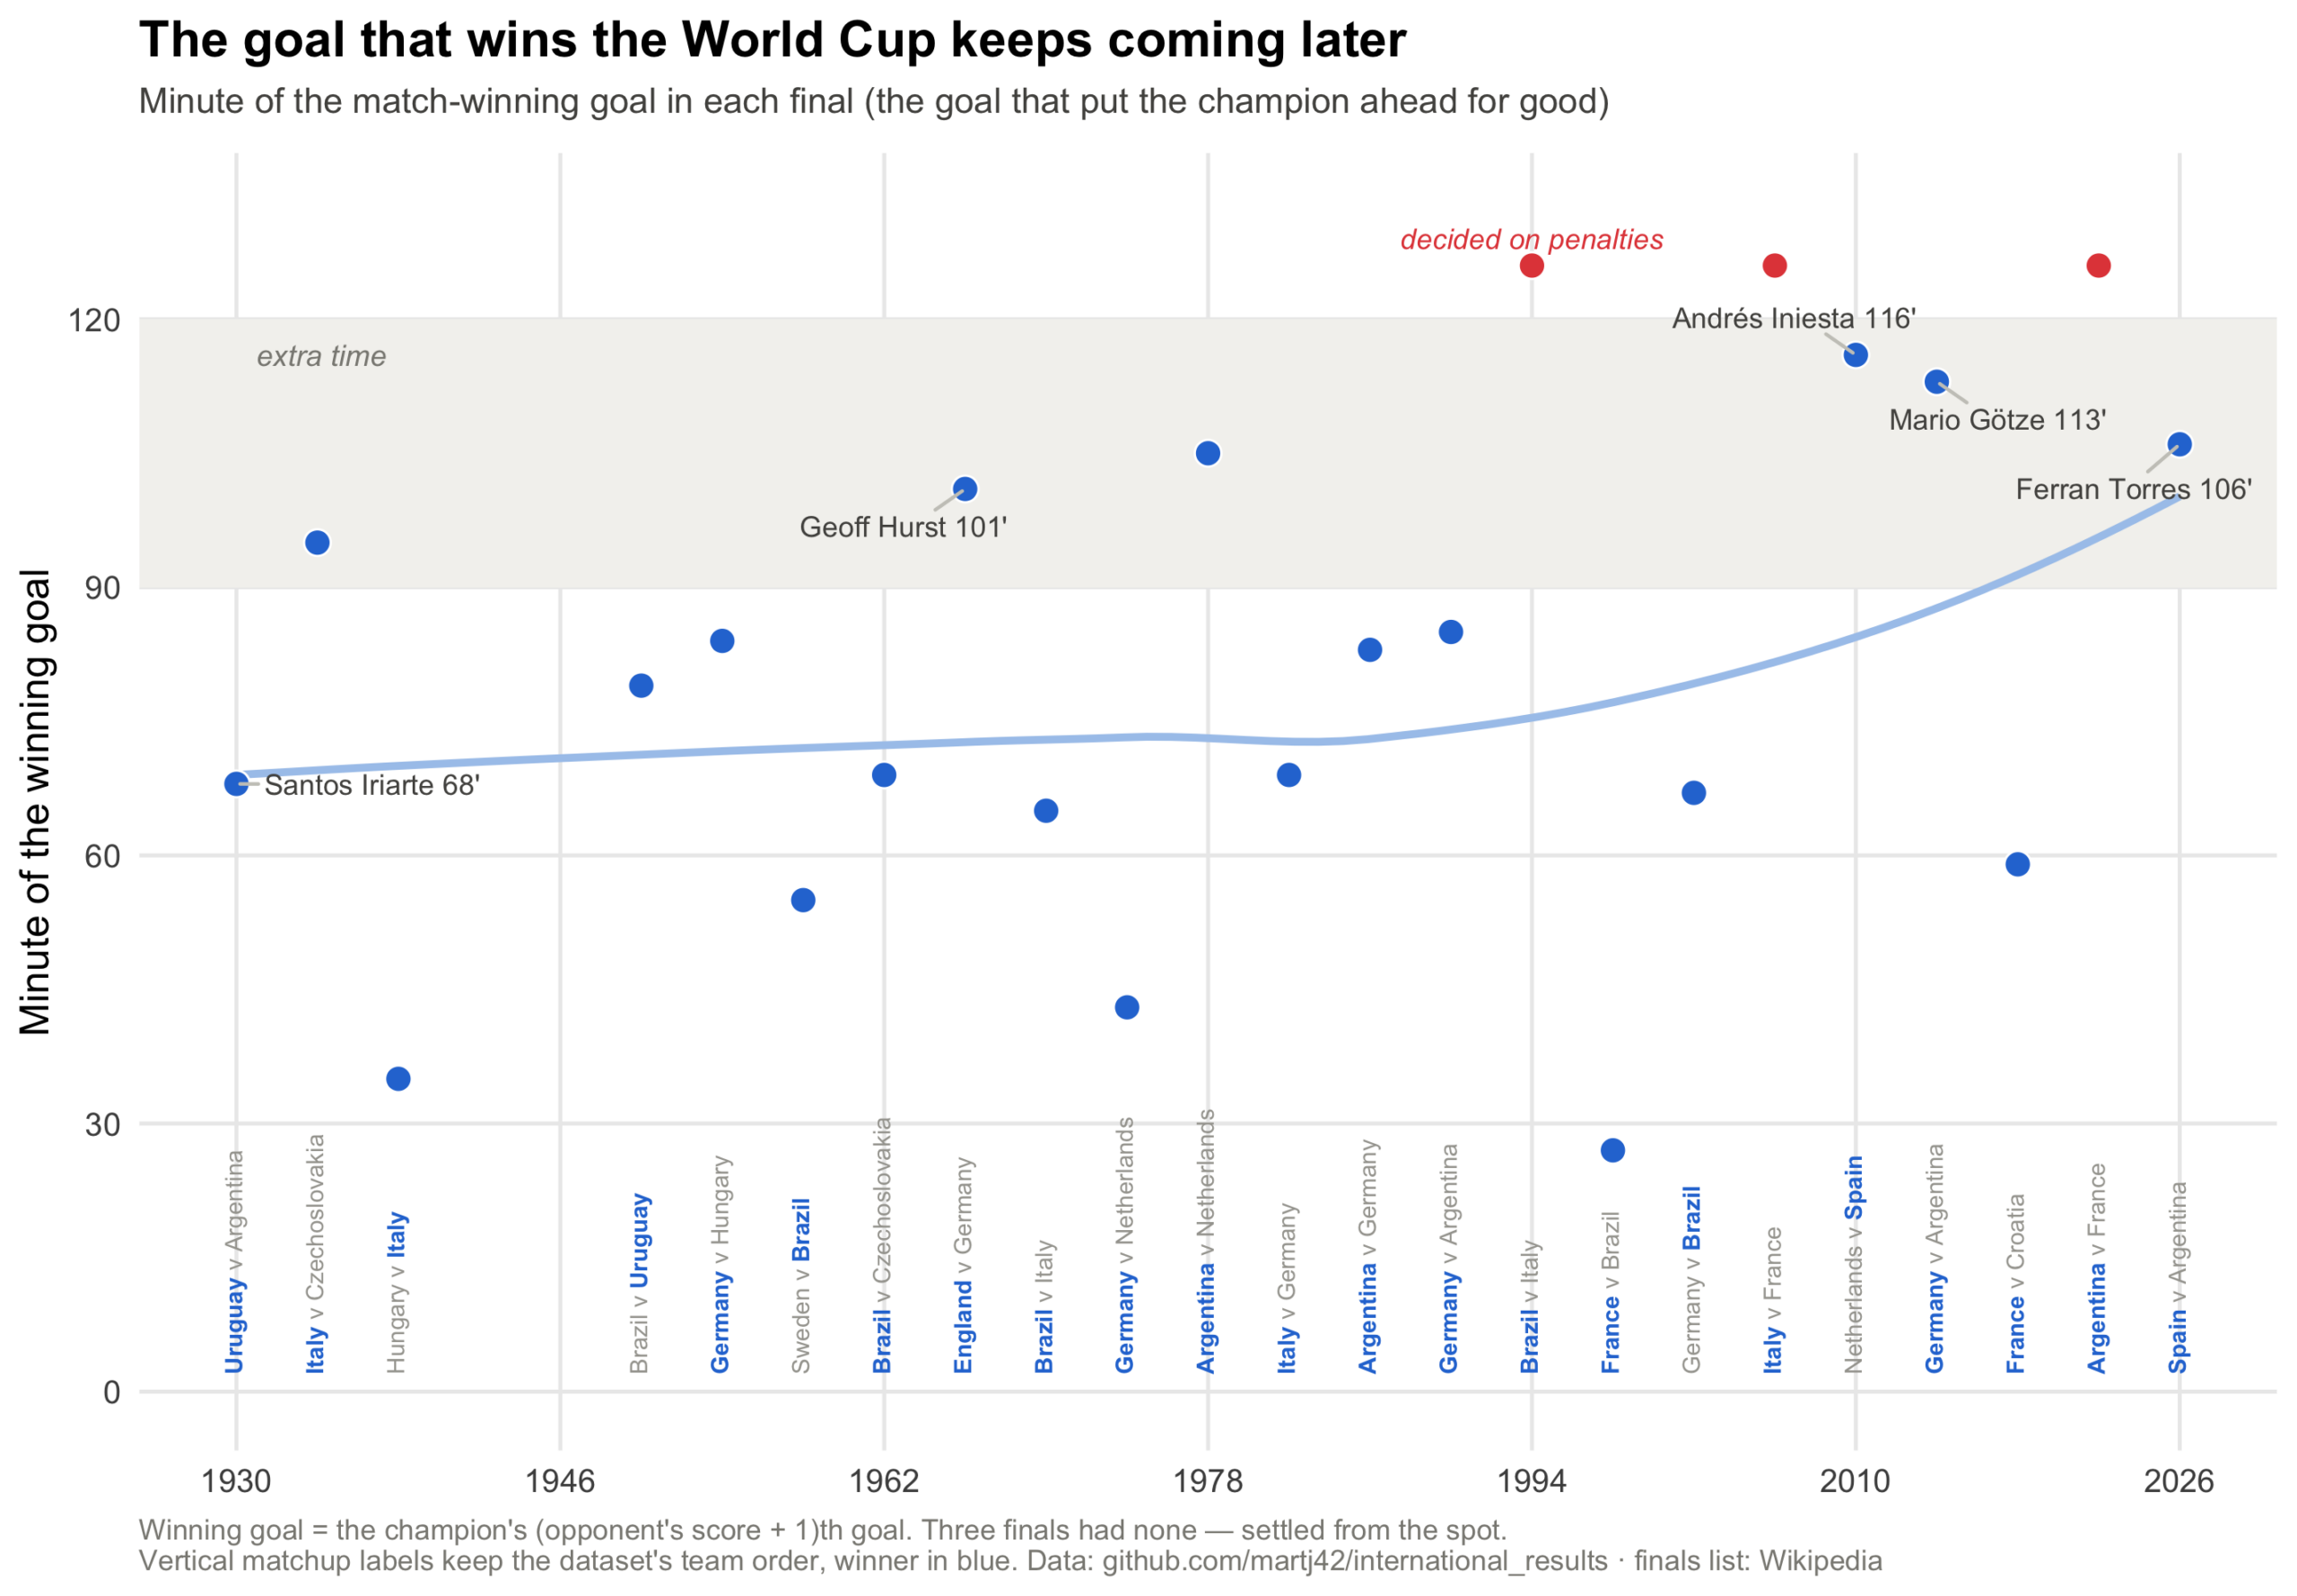
For the first sixty years the trend line barely moves: the average final was settled around the 70th minute, and Geoff Hurst’s 101st-minute goal in 1966 was a famous outlier. Since 1990 the line climbs steeply into the extra-time band. Iniesta in the 116th (2010), Götze in the 113th (2014), three finals with no winning goal at all (1994, 2006, 2022) — and now Ferran Torres in the 106th. Of the last ten World Cups, six were still level after 90 minutes of the final; of the first thirteen, only three were. The answer to the title’s question has shifted: the game that decides a World Cup has quietly grown half an hour longer.
