This is the fifth tutorial on the Spark RDDs Vs DataFrames vs SparkSQL blog post series. The first one is available here. In the first part, we saw how to retrieve, sort and filter data using Spark RDDs, DataFrames and SparkSQL.
In the second part (here), we saw how to work with multiple tables in Spark the RDD way, the DataFrame way and with SparkSQL. In the third part (available here) of the blog post series, we performed web server log analysis using real-world text-based production logs. In the fourth part (available here), we saw set operators in Spark the RDD way, the DataFrame way and the SparkSQL way. In this part, we will see how to use functions (scalar, aggerage and window functions).
Also, check out my other recent blog posts on Spark on Analyzing the Bible and the Quran using Spark, Spark DataFrames: Exploring Chicago Crimes and Leveraging Hive with Spark using Python.
The data and the notebooks can be downloaded from my GitHub repository.
from pyspark import SparkContext, SparkConf
conf = SparkConf().setMaster("local[*]")
sc = SparkContext.getOrCreate(conf)
from pyspark.sql import SparkSession
spark = SparkSession.builder.getOrCreate()
Changing a string to uppercase and rounding off a numeric field
Write a query to return the product name formatted as upper case and the weight of each product rounded to the nearest whole unit.
RDD way
Here, we use Python’s built-in functions round, int, float and the string method str.upper().
rdd = sc.textFile("SalesLTProduct.txt")
header = rdd.first()
content = rdd.filter(lambda line: line != header)\
          .filter(lambda line: line.split('\t')[7] != 'NULL')\
          .map(lambda line : (line.split('\t')[1].upper(), int(round(float(line.split('\t')[7]), 0))))
content.takeOrdered(10, lambda x: -x[1])
[('TOURING-3000 BLUE, 62', 13608),
 ('TOURING-3000 YELLOW, 62', 13608),
 ('TOURING-3000 BLUE, 58', 13562),
 ('TOURING-3000 YELLOW, 58', 13512),
 ('TOURING-3000 BLUE, 54', 13463),
 ('TOURING-3000 YELLOW, 54', 13345),
 ('TOURING-3000 YELLOW, 50', 13213),
 ('TOURING-3000 BLUE, 50', 13213),
 ('TOURING-3000 YELLOW, 44', 13050),
 ('TOURING-3000 BLUE, 44', 13050)]
DataFrame way
The functions we need from pyspark.sql module are imported below. Row can be used to create a row object by using named arguments. With Row we can create a DataFrame from an RDD using toDF. col returns a column based on the given column name.
from pyspark.sql.functions import col, round, upper
from pyspark.sql.types import *
from pyspark.sql import Row
df = rdd.filter(lambda line: line != header)\
          .filter(lambda line: line.split('\t')[7] != 'NULL')\
          .map(lambda line : Row(Name = line.split('\t')[1], Weight = line.split('\t')[7])).toDF()


df.withColumn("ApproxWeight", round(col("Weight").cast(DoubleType()), 0).cast(IntegerType()))\
.withColumn('Name',upper(col('Name'))).orderBy('ApproxWeight', ascending = False).show(10, truncate = False)
+-----------------------+--------+------------+
|Name                   |Weight  |ApproxWeight|
+-----------------------+--------+------------+
|TOURING-3000 YELLOW, 62|13607.70|13608       |
|TOURING-3000 BLUE, 62  |13607.70|13608       |
|TOURING-3000 BLUE, 58  |13562.34|13562       |
|TOURING-3000 YELLOW, 58|13512.45|13512       |
|TOURING-3000 BLUE, 54  |13462.55|13463       |
|TOURING-3000 YELLOW, 54|13344.62|13345       |
|TOURING-3000 BLUE, 50  |13213.08|13213       |
|TOURING-3000 YELLOW, 50|13213.08|13213       |
|TOURING-3000 BLUE, 44  |13049.78|13050       |
|TOURING-3000 YELLOW, 44|13049.78|13050       |
+-----------------------+--------+------------+
only showing top 10 rows
SQL way
To perform SQL operations, we have to first register our dataframe as a temporary table. We can use registerTempTable or createOrReplaceTempView to register our dataframe as a temporary table with the provided name.
df.createOrReplaceTempView('df_table')
spark.sql('select  upper(Name), int(round(Weight)) as ApproxWeight\
      from df_table order by ApproxWeight desc limit 10').show(10, truncate = False)
+-----------------------+------------+
|upper(Name)            |ApproxWeight|
+-----------------------+------------+
|TOURING-3000 BLUE, 62  |13608       |
|TOURING-3000 YELLOW, 62|13608       |
|TOURING-3000 BLUE, 58  |13562       |
|TOURING-3000 YELLOW, 58|13512       |
|TOURING-3000 BLUE, 54  |13463       |
|TOURING-3000 YELLOW, 54|13345       |
|TOURING-3000 BLUE, 50  |13213       |
|TOURING-3000 YELLOW, 50|13213       |
|TOURING-3000 YELLOW, 44|13050       |
|TOURING-3000 BLUE, 44  |13050       |
+-----------------------+------------+
Retrieve the year and month in which products were first sold
Get the year and month in which Adventure Works started selling each product.
RDD way
Let’s use the datetime Python package to parse the dates and times column. Since we do not need the time, let’s exclude tha and work with the string part that includes the year, month and day. Once we parse the date, we can use the year and month attributes to get the year and month in which each product started selling.
from datetime import datetime
def get_year(x):
     return datetime.strptime(x[:10], '%Y-%m-%d').year
def get_month(x):
        return datetime.strptime(x[:10], '%Y-%m-%d').month
content = rdd.filter(lambda line: line != header)\
          .filter(lambda line: line.split('\t')[7] != 'NULL')\
          .map(lambda line : (line.split('\t')[1].upper(), int(round(float(line.split('\t')[7]), 0)),
                              line.split('\t')[10], get_year(line.split('\t')[10]),  get_month(line.split('\t')[10])))
content.takeOrdered(10, lambda x: -x[1])
[('TOURING-3000 BLUE, 62', 13608, '2003-07-01 00:00:00.000', 2003, 7),
 ('TOURING-3000 YELLOW, 62', 13608, '2003-07-01 00:00:00.000', 2003, 7),
 ('TOURING-3000 BLUE, 58', 13562, '2003-07-01 00:00:00.000', 2003, 7),
 ('TOURING-3000 YELLOW, 58', 13512, '2003-07-01 00:00:00.000', 2003, 7),
 ('TOURING-3000 BLUE, 54', 13463, '2003-07-01 00:00:00.000', 2003, 7),
 ('TOURING-3000 YELLOW, 54', 13345, '2003-07-01 00:00:00.000', 2003, 7),
 ('TOURING-3000 YELLOW, 50', 13213, '2003-07-01 00:00:00.000', 2003, 7),
 ('TOURING-3000 BLUE, 50', 13213, '2003-07-01 00:00:00.000', 2003, 7),
 ('TOURING-3000 YELLOW, 44', 13050, '2003-07-01 00:00:00.000', 2003, 7),
 ('TOURING-3000 BLUE, 44', 13050, '2003-07-01 00:00:00.000', 2003, 7)]
DataFrame way
We can use the above python function to use with DataFrames by using the udf pyspark.sql functions.
from pyspark.sql.functions import udf
year_udf  = udf(get_year, IntegerType())
month_udf  = udf(get_month, IntegerType())
df = rdd.filter(lambda line: line != header)\
          .filter(lambda line: line.split('\t')[7] != 'NULL')\
          .map(lambda line : Row(Name = line.split('\t')[1], Weight = line.split('\t')[7],
                                SellStartDate = line.split('\t')[10])).toDF()
df.withColumn("ApproxWeight", round(col("Weight").cast(DoubleType()), 0).cast(IntegerType()))\
.withColumn('Name',upper(col('Name'))).withColumn('SellStartYear',year_udf(col('SellStartDate')))\
.withColumn('SellStartMonth',month_udf(col('SellStartDate'))).orderBy('ApproxWeight', ascending = False).show(10, truncate = False)
+-----------------------+-----------------------+--------+------------+-------------+--------------+
|Name                   |SellStartDate          |Weight  |ApproxWeight|SellStartYear|SellStartMonth|
+-----------------------+-----------------------+--------+------------+-------------+--------------+
|TOURING-3000 YELLOW, 62|2003-07-01 00:00:00.000|13607.70|13608       |2003         |7             |
|TOURING-3000 BLUE, 62  |2003-07-01 00:00:00.000|13607.70|13608       |2003         |7             |
|TOURING-3000 BLUE, 58  |2003-07-01 00:00:00.000|13562.34|13562       |2003         |7             |
|TOURING-3000 YELLOW, 58|2003-07-01 00:00:00.000|13512.45|13512       |2003         |7             |
|TOURING-3000 BLUE, 54  |2003-07-01 00:00:00.000|13462.55|13463       |2003         |7             |
|TOURING-3000 YELLOW, 54|2003-07-01 00:00:00.000|13344.62|13345       |2003         |7             |
|TOURING-3000 BLUE, 50  |2003-07-01 00:00:00.000|13213.08|13213       |2003         |7             |
|TOURING-3000 YELLOW, 50|2003-07-01 00:00:00.000|13213.08|13213       |2003         |7             |
|TOURING-3000 BLUE, 44  |2003-07-01 00:00:00.000|13049.78|13050       |2003         |7             |
|TOURING-3000 YELLOW, 44|2003-07-01 00:00:00.000|13049.78|13050       |2003         |7             |
+-----------------------+-----------------------+--------+------------+-------------+--------------+
only showing top 10 rows
SQL way
Let’s register our table as a temporary table and then we can use year and month Hive functions to get the year and month in which the product was started selling.
df.createOrReplaceTempView('df_table2')
df.printSchema()
root
 |-- Name: string (nullable = true)
 |-- SellStartDate: string (nullable = true)
 |-- Weight: string (nullable = true)
spark.sql('select  upper(Name) as Name, int(round(Weight)) as ApproxWeight, SellStartDate,\
      year(SellStartDate) as SellStartYear, month(SellStartDate) as SellStartMonth\
     from df_table2 order by ApproxWeight desc limit 10').show(10, truncate = False)
+-----------------------+------------+-----------------------+-------------+--------------+
|Name                   |ApproxWeight|SellStartDate          |SellStartYear|SellStartMonth|
+-----------------------+------------+-----------------------+-------------+--------------+
|TOURING-3000 YELLOW, 62|13608       |2003-07-01 00:00:00.000|2003         |7             |
|TOURING-3000 BLUE, 62  |13608       |2003-07-01 00:00:00.000|2003         |7             |
|TOURING-3000 BLUE, 58  |13562       |2003-07-01 00:00:00.000|2003         |7             |
|TOURING-3000 YELLOW, 58|13512       |2003-07-01 00:00:00.000|2003         |7             |
|TOURING-3000 BLUE, 54  |13463       |2003-07-01 00:00:00.000|2003         |7             |
|TOURING-3000 YELLOW, 54|13345       |2003-07-01 00:00:00.000|2003         |7             |
|TOURING-3000 BLUE, 50  |13213       |2003-07-01 00:00:00.000|2003         |7             |
|TOURING-3000 YELLOW, 50|13213       |2003-07-01 00:00:00.000|2003         |7             |
|TOURING-3000 BLUE, 44  |13050       |2003-07-01 00:00:00.000|2003         |7             |
|TOURING-3000 YELLOW, 44|13050       |2003-07-01 00:00:00.000|2003         |7             |
+-----------------------+------------+-----------------------+-------------+--------------+
String Extraction
The leftmost two characters show the product type. Now, let’s extract the first two characters and include to our previous query.
RDD way
rdd = sc.textFile("SalesLTProduct.txt")
header = rdd.first()
content = rdd.filter(lambda line: line != header)\
          .filter(lambda line: line.split('\t')[7] != 'NULL')\
          .map(lambda line : (line.split('\t')[1].upper(), line.split('\t')[2][:2], int(round(float(line.split('\t')[7]), 0)),
                              line.split('\t')[10], get_year(line.split('\t')[10]),  get_month(line.split('\t')[10])))
content.takeOrdered(10, lambda x: -x[2])
[('TOURING-3000 BLUE, 62', 'BK', 13608, '2003-07-01 00:00:00.000', 2003, 7),
 ('TOURING-3000 YELLOW, 62', 'BK', 13608, '2003-07-01 00:00:00.000', 2003, 7),
 ('TOURING-3000 BLUE, 58', 'BK', 13562, '2003-07-01 00:00:00.000', 2003, 7),
 ('TOURING-3000 YELLOW, 58', 'BK', 13512, '2003-07-01 00:00:00.000', 2003, 7),
 ('TOURING-3000 BLUE, 54', 'BK', 13463, '2003-07-01 00:00:00.000', 2003, 7),
 ('TOURING-3000 YELLOW, 54', 'BK', 13345, '2003-07-01 00:00:00.000', 2003, 7),
 ('TOURING-3000 YELLOW, 50', 'BK', 13213, '2003-07-01 00:00:00.000', 2003, 7),
 ('TOURING-3000 BLUE, 50', 'BK', 13213, '2003-07-01 00:00:00.000', 2003, 7),
 ('TOURING-3000 YELLOW, 44', 'BK', 13050, '2003-07-01 00:00:00.000', 2003, 7),
 ('TOURING-3000 BLUE, 44', 'BK', 13050, '2003-07-01 00:00:00.000', 2003, 7)]
DataFrame
The below simple udf helps to extract the first two letters.
left_two = udf(lambda x: x[:2])
df  =  rdd.filter(lambda line: line != header)\
          .filter(lambda line: line.split('\t')[7] != 'NULL')\
          .map(lambda line : Row(Name = line.split('\t')[1], ProductNumber = line.split('\t')[2],
                                 Weight = line.split('\t')[7],
                                SellStartDate = line.split('\t')[10])).toDF()
df.withColumn("ApproxWeight", round(col("Weight").cast(DoubleType()), 0).cast(IntegerType()))\
.withColumn('ProductNumber', left_two(col('ProductNumber')))\
.withColumn('Name',upper(col('Name'))).withColumn('SellStartYear',year_udf(col('SellStartDate')))\
.withColumn('SellStartMonth', month_udf(col('SellStartDate'))).orderBy('ApproxWeight', ascending = False).show(10, truncate = False)
+-----------------------+-------------+-----------------------+--------+------------+-------------+--------------+
|Name                   |ProductNumber|SellStartDate          |Weight  |ApproxWeight|SellStartYear|SellStartMonth|
+-----------------------+-------------+-----------------------+--------+------------+-------------+--------------+
|TOURING-3000 BLUE, 62  |BK           |2003-07-01 00:00:00.000|13607.70|13608       |2003         |7             |
|TOURING-3000 YELLOW, 62|BK           |2003-07-01 00:00:00.000|13607.70|13608       |2003         |7             |
|TOURING-3000 BLUE, 58  |BK           |2003-07-01 00:00:00.000|13562.34|13562       |2003         |7             |
|TOURING-3000 YELLOW, 58|BK           |2003-07-01 00:00:00.000|13512.45|13512       |2003         |7             |
|TOURING-3000 BLUE, 54  |BK           |2003-07-01 00:00:00.000|13462.55|13463       |2003         |7             |
|TOURING-3000 YELLOW, 54|BK           |2003-07-01 00:00:00.000|13344.62|13345       |2003         |7             |
|TOURING-3000 YELLOW, 50|BK           |2003-07-01 00:00:00.000|13213.08|13213       |2003         |7             |
|TOURING-3000 BLUE, 50  |BK           |2003-07-01 00:00:00.000|13213.08|13213       |2003         |7             |
|TOURING-3000 BLUE, 44  |BK           |2003-07-01 00:00:00.000|13049.78|13050       |2003         |7             |
|TOURING-3000 YELLOW, 44|BK           |2003-07-01 00:00:00.000|13049.78|13050       |2003         |7             |
+-----------------------+-------------+-----------------------+--------+------------+-------------+--------------+
only showing top 10 rows
SQL
We can use the Hive function substr to extract the first two letters. Let’s first see what this function does.
spark.sql('describe function substr').show(truncate = False)
+------------------------------------------------------------------------------------------------------------------------------------------------------------------------------------+
|function_desc                                                                                                                                                                       |
+------------------------------------------------------------------------------------------------------------------------------------------------------------------------------------+
|Function: substr                                                                                                                                                                    |
|Class: org.apache.spark.sql.catalyst.expressions.Substring                                                                                                                          |
|Usage: substr(str, pos[, len]) - Returns the substring of `str` that starts at `pos` and is of length `len`, or the slice of byte array that starts at `pos` and is of length `len`.|
+------------------------------------------------------------------------------------------------------------------------------------------------------------------------------------+
Now, let’s register our table as a temporary table and perform our SQL operations.
df.createOrReplaceTempView('df_table3')
spark.sql('select  upper(Name) as Name, substr(ProductNumber, 1, 2) as ProductNumber,  int(round(Weight)) as ApproxWeight, SellStartDate,\
      year(SellStartDate) as SellStartYear, month(SellStartDate) as SellStartMonth\
     from df_table3 order by ApproxWeight desc limit 10').show(10, truncate = False)
+-----------------------+-------------+------------+-----------------------+-------------+--------------+
|Name                   |ProductNumber|ApproxWeight|SellStartDate          |SellStartYear|SellStartMonth|
+-----------------------+-------------+------------+-----------------------+-------------+--------------+
|TOURING-3000 BLUE, 62  |BK           |13608       |2003-07-01 00:00:00.000|2003         |7             |
|TOURING-3000 YELLOW, 62|BK           |13608       |2003-07-01 00:00:00.000|2003         |7             |
|TOURING-3000 BLUE, 58  |BK           |13562       |2003-07-01 00:00:00.000|2003         |7             |
|TOURING-3000 YELLOW, 58|BK           |13512       |2003-07-01 00:00:00.000|2003         |7             |
|TOURING-3000 BLUE, 54  |BK           |13463       |2003-07-01 00:00:00.000|2003         |7             |
|TOURING-3000 YELLOW, 54|BK           |13345       |2003-07-01 00:00:00.000|2003         |7             |
|TOURING-3000 BLUE, 50  |BK           |13213       |2003-07-01 00:00:00.000|2003         |7             |
|TOURING-3000 YELLOW, 50|BK           |13213       |2003-07-01 00:00:00.000|2003         |7             |
|TOURING-3000 YELLOW, 44|BK           |13050       |2003-07-01 00:00:00.000|2003         |7             |
|TOURING-3000 BLUE, 44  |BK           |13050       |2003-07-01 00:00:00.000|2003         |7             |
+-----------------------+-------------+------------+-----------------------+-------------+--------------+
Retrieve only products with a numeric size
The size field can be numeric such as 48, 58, etc or it can be letters such as M for medium, S for short and L for Large. Now, let’s extend our query to filter the product returned so that only products with a numeric size are included.
RDD way
There could be different ways of doing this but I am using the re module to use regular expression matching. I personally prefer regular expressions because they help to solve a wider set of problems.
import re
def isNumeric(x):
    return bool(re.match('[0-9]', x))
content = rdd.filter(lambda line: line != header)\
          .filter(lambda line: line.split('\t')[7] != 'NULL')\
          .filter(lambda line: isNumeric(line.split('\t')[6]))\
          .map(lambda line : (line.split('\t')[1].upper(), line.split('\t')[2][:2], \
                              int(round(float(line.split('\t')[7]), 0)), line.split('\t')[6], \
                              get_year(line.split('\t')[10]),  get_month(line.split('\t')[10])))
content.takeOrdered(10, lambda x: -x[2])
[('TOURING-3000 BLUE, 62', 'BK', 13608, '62', 2003, 7),
 ('TOURING-3000 YELLOW, 62', 'BK', 13608, '62', 2003, 7),
 ('TOURING-3000 BLUE, 58', 'BK', 13562, '58', 2003, 7),
 ('TOURING-3000 YELLOW, 58', 'BK', 13512, '58', 2003, 7),
 ('TOURING-3000 BLUE, 54', 'BK', 13463, '54', 2003, 7),
 ('TOURING-3000 YELLOW, 54', 'BK', 13345, '54', 2003, 7),
 ('TOURING-3000 YELLOW, 50', 'BK', 13213, '50', 2003, 7),
 ('TOURING-3000 BLUE, 50', 'BK', 13213, '50', 2003, 7),
 ('TOURING-3000 YELLOW, 44', 'BK', 13050, '44', 2003, 7),
 ('TOURING-3000 BLUE, 44', 'BK', 13050, '44', 2003, 7)]
We change a Python function to a user defined function (UDF) by passing the output data type.
is_Numeric = udf(isNumeric, BooleanType() )
df  =  rdd.filter(lambda line: line != header)\
           .filter(lambda line: line.split('\t')[7] != 'NULL')\
           .map(lambda line : Row(Name = line.split('\t')[1], ProductNumber = line.split('\t')[2],
                                  size = line.split('\t')[6], Weight = line.split('\t')[7],
                                SellStartDate = line.split('\t')[10])).toDF()
df.withColumn("ApproxWeight", round(col("Weight").cast(DoubleType()), 0).cast(IntegerType()))\
.filter(is_Numeric(col('size')))\
.withColumn('ProductNumber', left_two(col('ProductNumber')))\
.withColumn('Name',upper(col('Name'))).withColumn('SellStartYear',year_udf(col('SellStartDate')))\
.withColumn('SellStartMonth', month_udf(col('SellStartDate'))).orderBy('ApproxWeight', ascending = False).show(10, truncate = False)
+-----------------------+-------------+-----------------------+--------+----+------------+-------------+--------------+
|Name                   |ProductNumber|SellStartDate          |Weight  |size|ApproxWeight|SellStartYear|SellStartMonth|
+-----------------------+-------------+-----------------------+--------+----+------------+-------------+--------------+
|TOURING-3000 YELLOW, 62|BK           |2003-07-01 00:00:00.000|13607.70|62  |13608       |2003         |7             |
|TOURING-3000 BLUE, 62  |BK           |2003-07-01 00:00:00.000|13607.70|62  |13608       |2003         |7             |
|TOURING-3000 BLUE, 58  |BK           |2003-07-01 00:00:00.000|13562.34|58  |13562       |2003         |7             |
|TOURING-3000 YELLOW, 58|BK           |2003-07-01 00:00:00.000|13512.45|58  |13512       |2003         |7             |
|TOURING-3000 BLUE, 54  |BK           |2003-07-01 00:00:00.000|13462.55|54  |13463       |2003         |7             |
|TOURING-3000 YELLOW, 54|BK           |2003-07-01 00:00:00.000|13344.62|54  |13345       |2003         |7             |
|TOURING-3000 BLUE, 50  |BK           |2003-07-01 00:00:00.000|13213.08|50  |13213       |2003         |7             |
|TOURING-3000 YELLOW, 50|BK           |2003-07-01 00:00:00.000|13213.08|50  |13213       |2003         |7             |
|TOURING-3000 BLUE, 44  |BK           |2003-07-01 00:00:00.000|13049.78|44  |13050       |2003         |7             |
|TOURING-3000 YELLOW, 44|BK           |2003-07-01 00:00:00.000|13049.78|44  |13050       |2003         |7             |
+-----------------------+-------------+-----------------------+--------+----+------------+-------------+--------------+
only showing top 10 rows
SQL
df.createOrReplaceTempView('df_table4')
In Hive to check weather a field is numeric or not is to cast that column to numeric and see if the output is numeric. Non-numeric fields will be NULL and we can easily filter them aout as shown below.
spark.sql('select  upper(Name) as Name,  substr(ProductNumber, 1, 2) as ProductNumber, size, int(round(Weight)) as ApproxWeight, SellStartDate,\
      year(SellStartDate) as SellStartYear, month(SellStartDate) as SellStartMonth\
     from df_table4 where cast(size as double) is not null order by ApproxWeight desc limit 10').show(10, truncate = False)
+-----------------------+-------------+----+------------+-----------------------+-------------+--------------+
|Name                   |ProductNumber|size|ApproxWeight|SellStartDate          |SellStartYear|SellStartMonth|
+-----------------------+-------------+----+------------+-----------------------+-------------+--------------+
|TOURING-3000 YELLOW, 62|BK           |62  |13608       |2003-07-01 00:00:00.000|2003         |7             |
|TOURING-3000 BLUE, 62  |BK           |62  |13608       |2003-07-01 00:00:00.000|2003         |7             |
|TOURING-3000 BLUE, 58  |BK           |58  |13562       |2003-07-01 00:00:00.000|2003         |7             |
|TOURING-3000 YELLOW, 58|BK           |58  |13512       |2003-07-01 00:00:00.000|2003         |7             |
|TOURING-3000 BLUE, 54  |BK           |54  |13463       |2003-07-01 00:00:00.000|2003         |7             |
|TOURING-3000 YELLOW, 54|BK           |54  |13345       |2003-07-01 00:00:00.000|2003         |7             |
|TOURING-3000 BLUE, 50  |BK           |50  |13213       |2003-07-01 00:00:00.000|2003         |7             |
|TOURING-3000 YELLOW, 50|BK           |50  |13213       |2003-07-01 00:00:00.000|2003         |7             |
|TOURING-3000 BLUE, 44  |BK           |44  |13050       |2003-07-01 00:00:00.000|2003         |7             |
|TOURING-3000 YELLOW, 44|BK           |44  |13050       |2003-07-01 00:00:00.000|2003         |7             |
+-----------------------+-------------+----+------------+-----------------------+-------------+--------------+
Window Functions
Let’s use Spark SQL and DataFrame APIs ro retrieve companies ranked by sales totals from the SalesOrderHeader and SalesLTCustomer tables. We will display the first 10 rows from the solution using each method to just compare our answers to make sure we are doing it right.
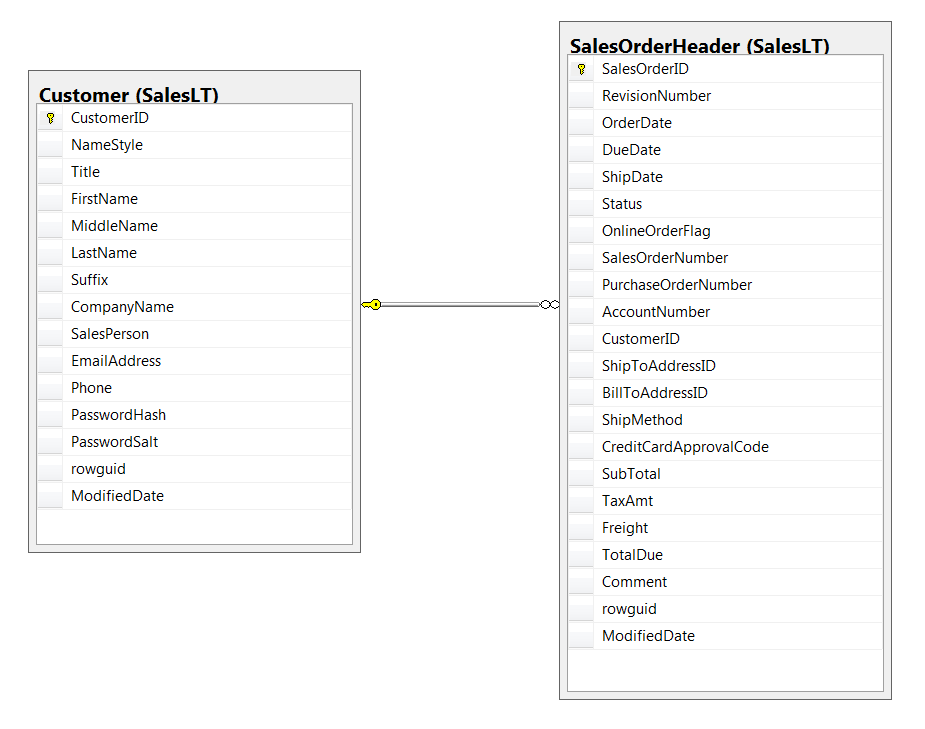
orderHeader = sc.textFile("SalesLTSalesOrderHeader.txt")
header = orderHeader.first()
orderHeader_rdd =   orderHeader.filter(lambda line: line != header)
orderHeader_df = orderHeader_rdd.map(lambda line: Row(CustomerID = line.split('\t')[10],
                                                     TotalDue = float(line.split('\t')[-4] ))).toDF()
customer = sc.textFile("SalesLTCustomer.txt")
header = customer.first()
customer_rdd =   customer.filter(lambda line: line != header)
customer_df = customer_rdd.map(lambda line: Row(CustomerID = line.split('\t')[0],
                                            CompanyName = line.split('\t')[7])).toDF()
customer_df.printSchema()
root
 |-- CompanyName: string (nullable = true)
 |-- CustomerID: string (nullable = true)

orderHeader_df.printSchema()
root
 |-- CustomerID: string (nullable = true)
 |-- TotalDue: double (nullable = true)
DataFrame way
rank returns the rank of rows within a window partition. We use Window to specify the columns for partitioning and ordering.
from pyspark.sql.functions import col
from pyspark.sql.functions import rank
from pyspark.sql.window import Window
windowspecs = Window.orderBy(-col('TotalDue'))
df = customer_df.join(orderHeader_df, 'CustomerID','inner')\
.select('CompanyName','TotalDue')
df.withColumn('rank', rank().over(windowspecs)).show(10, truncate = False)
+------------------------------+-----------+----+
|CompanyName                   |TotalDue   |rank|
+------------------------------+-----------+----+
|Action Bicycle Specialists    |119960.824 |1   |
|Metropolitan Bicycle Supply   |108597.9536|2   |
|Bulk Discount Store           |98138.2131 |3   |
|Eastside Department Store     |92663.5609 |4   |
|Riding Cycles                 |86222.8072 |5   |
|Many Bikes Store              |81834.9826 |6   |
|Instruments and Parts Company |70698.9922 |7   |
|Extreme Riding Supplies       |63686.2708 |8   |
|Trailblazing Sports           |45992.3665 |9   |
|Professional Sales and Service|43962.7901 |10  |
+------------------------------+-----------+----+
only showing top 10 rows
SQL
Here, we can use the normal SQL rank function.
customer_df.createOrReplaceTempView('customer_table')
orderHeader_df.createOrReplaceTempView('orderHeader_table')
spark.sql('select c.CompanyName, o.TotalDue,\
Rank() OVER (ORDER BY TotalDue DESC ) AS RankByRevenue FROM customer_table AS c \
INNER JOIN orderHeader_table AS o ON c.CustomerID = o.CustomerID').show(10, truncate = False)
+------------------------------+-----------+-------------+
|CompanyName                   |TotalDue   |RankByRevenue|
+------------------------------+-----------+-------------+
|Action Bicycle Specialists    |119960.824 |1            |
|Metropolitan Bicycle Supply   |108597.9536|2            |
|Bulk Discount Store           |98138.2131 |3            |
|Eastside Department Store     |92663.5609 |4            |
|Riding Cycles                 |86222.8072 |5            |
|Many Bikes Store              |81834.9826 |6            |
|Instruments and Parts Company |70698.9922 |7            |
|Extreme Riding Supplies       |63686.2708 |8            |
|Trailblazing Sports           |45992.3665 |9            |
|Professional Sales and Service|43962.7901 |10           |
+------------------------------+-----------+-------------+
only showing top 10 rows
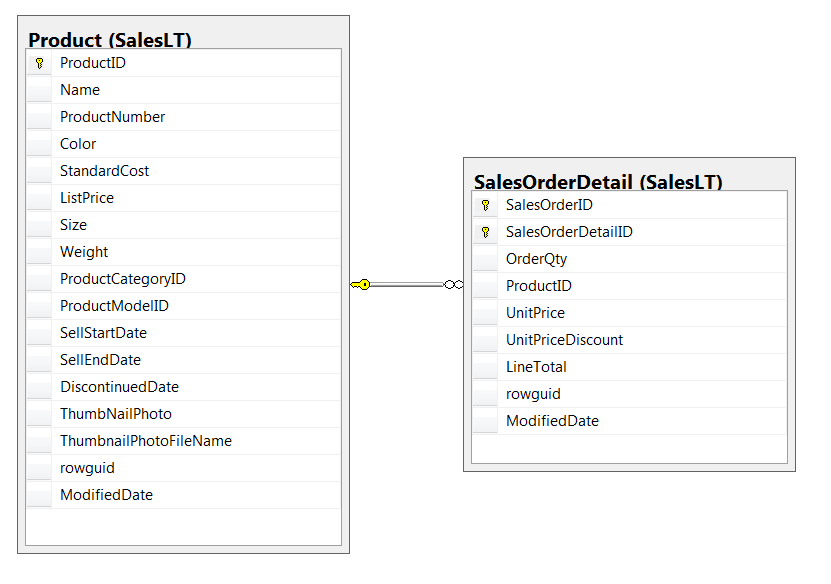
Write a query to retrieve a list of the product names and the total revenue
calculated as the sum of the LineTotal from the SalesLT.SalesOrderDetail table, with the results sorted in descending order of total revenue.
Let’s display 10 records from each method to compare the answers.
RDD way
orderDetail = sc.textFile("SalesLTSalesOrderDetail.txt")
header1 = orderDetail.first()
orderDetail_rdd = orderDetail.filter(lambda line: line != header1 )\
                  .map(lambda line: (line.split('\t')[3], float(line.split('\t')[6])))
product = sc.textFile("SalesLTProduct.txt")
header2 = product.first()
product_rdd = product.filter(lambda line: line != header2)\
            .map(lambda line: (line.split('\t')[0], (line.split('\t')[1], float(line.split('\t')[5]))))
product_rdd.join(orderDetail_rdd)\
.map(lambda line: (line[1][0][0],line[1][1]))\
.reduceByKey(lambda a, b: a+b)\
.sortBy(lambda x: -x[1])\
.take(10)
[('Touring-1000 Blue, 60', 37191.492),
 ('Mountain-200 Black, 42', 37178.838),
 ('Road-350-W Yellow, 48', 36486.2355),
 ('Mountain-200 Black, 38', 35801.844),
 ('Touring-1000 Yellow, 60', 23413.474656),
 ('Touring-1000 Blue, 50', 22887.072),
 ('Mountain-200 Silver, 42', 20879.91),
 ('Road-350-W Yellow, 40', 20411.88),
 ('Mountain-200 Black, 46', 19277.916),
 ('Road-350-W Yellow, 42', 18692.519308)]
DataFrame way
orderDetail_df = orderDetail.filter(lambda line: line != header1 )\
                             .map(lambda line: Row(ProductID = line.split('\t')[3],
                                                 LineTotal = float(line.split('\t')[6]))).toDF()
product_df = product.filter(lambda line: line != header2)\
                     .map(lambda line: Row(ProductID = line.split('\t')[0],
                                             Name = line.split('\t')[1],
                                             ListPrice = float(line.split('\t')[5]))).toDF()
orderDetail_df.printSchema()
root
 |-- LineTotal: double (nullable = true)
 |-- ProductID: string (nullable = true)
product_df.printSchema()
root
 |-- ListPrice: double (nullable = true)
 |-- Name: string (nullable = true)
 |-- ProductID: string (nullable = true)
product_df.join(orderDetail_df,'ProductID','inner')\
.groupBy('Name').agg({'LineTotal':'sum'}).orderBy('sum(LineTotal)', ascending = False)\
.show(10, truncate = False)
+-----------------------+--------------+
|Name                   |sum(LineTotal)|
+-----------------------+--------------+
|Touring-1000 Blue, 60  |37191.492     |
|Mountain-200 Black, 42 |37178.838     |
|Road-350-W Yellow, 48  |36486.2355    |
|Mountain-200 Black, 38 |35801.844     |
|Touring-1000 Yellow, 60|23413.474656  |
|Touring-1000 Blue, 50  |22887.072     |
|Mountain-200 Silver, 42|20879.91      |
|Road-350-W Yellow, 40  |20411.88      |
|Mountain-200 Black, 46 |19277.916     |
|Road-350-W Yellow, 42  |18692.519308  |
+-----------------------+--------------+
only showing top 10 rows
SQL
orderDetail_df.createOrReplaceTempView('orderDetail_table')
product_df.createOrReplaceTempView('product_df_table')
spark.sql('SELECT Name,SUM(LineTotal) AS TotalRevenue FROM product_df_table AS p \
INNER JOIN orderDetail_table AS o ON o.ProductID = p.ProductID \
GROUP BY Name ORDER BY TotalRevenue DESC').show(10, truncate = False)
+-----------------------+------------+
|Name                   |TotalRevenue|
+-----------------------+------------+
|Touring-1000 Blue, 60  |37191.492   |
|Mountain-200 Black, 42 |37178.838   |
|Road-350-W Yellow, 48  |36486.2355  |
|Mountain-200 Black, 38 |35801.844   |
|Touring-1000 Yellow, 60|23413.474656|
|Touring-1000 Blue, 50  |22887.072   |
|Mountain-200 Silver, 42|20879.91    |
|Road-350-W Yellow, 40  |20411.88    |
|Mountain-200 Black, 46 |19277.916   |
|Road-350-W Yellow, 42  |18692.519308|
+-----------------------+------------+
only showing top 10 rows
Modify the previous query to include sales totals for products that have a list price of more than $1000
RDD way
orderDetail = sc.textFile("SalesLTSalesOrderDetail.txt")
header1 = orderDetail.first()
orderDetail_rdd = orderDetail.filter(lambda line: line != header1 )\
                  .map(lambda line: (line.split('\t')[3], float(line.split('\t')[6])))
product = sc.textFile("SalesLTProduct.txt")
header2 = product.first()
product_rdd = product.filter(lambda line: line != header2)\
              .filter(lambda line: float(line.split('\t')[5]) > 1000)\
              .map(lambda line: (line.split('\t')[0], (line.split('\t')[1], float(line.split('\t')[5]))))
rdd_answer = product_rdd.join(orderDetail_rdd)\
.map(lambda line: (line[1][0][0],line[1][1]))\
.reduceByKey(lambda a, b: a + b)\
.sortBy(lambda x: -x[1])
DataFrame way
orderDetail_df = orderDetail.filter(lambda line: line != header1 )\
                             .map(lambda line: Row(ProductID = line.split('\t')[3],
                                                 LineTotal = float(line.split('\t')[6]))).toDF()
product_df = product.filter(lambda line: line != header2)\
                     .map(lambda line: Row(ProductID = line.split('\t')[0],
                                             Name = line.split('\t')[1],
                                             ListPrice = float(line.split('\t')[5]))).toDF()
df_answer = product_df.filter(product_df.ListPrice > 1000)\
           .join(orderDetail_df,'ProductID','inner')\
           .groupBy('Name').agg({'LineTotal':'sum'}).orderBy('sum(LineTotal)', ascending = False)
SQL
sql_answer = spark.sql('SELECT Name,SUM(LineTotal) AS TotalRevenue FROM product_df_table AS p \
INNER JOIN orderDetail_table AS o ON o.ProductID = p.ProductID \
WHERE p.ListPrice > 1000 GROUP BY Name ORDER BY TotalRevenue DESC')
Filter the product sales groups to include only total sales over 20,000
Modify the previous query to only include only product groups with a total sales value greater than 20,000 dollars.
RDD way
for i in rdd_answer.filter(lambda line: line[1] > 20000).collect():
  print(i)
('Touring-1000 Blue, 60', 37191.492)
('Mountain-200 Black, 42', 37178.838)
('Road-350-W Yellow, 48', 36486.2355)
('Mountain-200 Black, 38', 35801.844)
('Touring-1000 Yellow, 60', 23413.474656)
('Touring-1000 Blue, 50', 22887.072)
('Mountain-200 Silver, 42', 20879.91)
('Road-350-W Yellow, 40', 20411.88)
DataFrame
for i in df_answer.filter(df_answer['sum(LineTotal)'] > 20000).collect():
    print((i[0],i[1]))
('Touring-1000 Blue, 60', 37191.492)
('Mountain-200 Black, 42', 37178.838)
('Road-350-W Yellow, 48', 36486.2355)
('Mountain-200 Black, 38', 35801.844)
('Touring-1000 Yellow, 60', 23413.474656)
('Touring-1000 Blue, 50', 22887.072)
('Mountain-200 Silver, 42', 20879.91)
('Road-350-W Yellow, 40', 20411.88)
SQL
spark.sql('SELECT Name,SUM(LineTotal) AS TotalRevenue FROM product_df_table AS p \
INNER JOIN orderDetail_table AS o ON o.ProductID = p.ProductID \
WHERE p.ListPrice > 1000 GROUP BY Name \
HAVING SUM(LineTotal) > 20000 ORDER BY TotalRevenue DESC').show(truncate = False)
+-----------------------+------------+
|Name                   |TotalRevenue|
+-----------------------+------------+
|Touring-1000 Blue, 60  |37191.492   |
|Mountain-200 Black, 42 |37178.838   |
|Road-350-W Yellow, 48  |36486.2355  |
|Mountain-200 Black, 38 |35801.844   |
|Touring-1000 Yellow, 60|23413.474656|
|Touring-1000 Blue, 50  |22887.072   |
|Mountain-200 Silver, 42|20879.91    |
|Road-350-W Yellow, 40  |20411.88    |
+-----------------------+------------+
We see that the answers from the three approaches are the same.
This is enough for today. See you in the next part of the Spark with Python tutorial series.