
I wanted a folder of weather station files as one data frame, and I assumed that part of the job would take one line. It does take one line, right up until the files stop agreeing with each other. Three things went wrong on the way, and each of them fails in a way that looks like something else. Here is the short version of all three, with the fix that ends up handling real folders.
How do I read multiple CSV files into one data frame in R?
Pass the whole vector of file paths to read_csv(). Since readr 2.0 it accepts a character vector instead of a single path, reads the files in one call, and stacks them for you. Add id = and it records which file each row came from, which you almost always want and almost always forget to keep.
This block runs on its own, no download needed. It writes three CSV files and reads them back as one tibble.
library(readr)
library(dplyr)
library(purrr)

demo_dir <- file.path(tempdir(), "demo")
dir.create(demo_dir, showWarnings = FALSE)
walk(split(mtcars, mtcars$cyl),
     \(g) write_csv(g, file.path(demo_dir, paste0("cyl", g$cyl[1], ".csv"))))

cars <- read_csv(list.files(demo_dir, pattern = "\\.csv$", full.names = TRUE),
                 id = "file", show_col_types = FALSE)

cars |> count(file = basename(file))
## # A tibble: 3 × 2
##   file         n
##   <chr>    <int>
## 1 cyl4.csv    11
## 2 cyl6.csv     7
## 3 cyl8.csv    14
No loop, no do.call(rbind, lapply(...)), and no plyr::ldply(), which is what this task used to require. Note full.names = TRUE: without it you get bare file names, and read_csv() looks for them in the working directory rather than in the folder you listed.
Why pattern = "*.csv" in list.files() is a regex, not a glob
"*.csv" looks like a shell glob and is read as a regex, where it means "any character, then csv, anywhere in the name". It matches far more than you intended. The pattern that means what people think *.csv means is "\\.csv$".
I will use NOAA’s Global Summary of the Year, one file per weather station, no key or registration. Open data almost always ships a readme next to the data, so I write one here too.
stations <- c("USW00094728", "USW00023174", "USW00013874")  # New York, Los Angeles, Atlanta
folder <- file.path(tempdir(), "stations")
dir.create(folder, showWarnings = FALSE)

walk(stations, \(s) {
  target <- file.path(folder, paste0(s, ".csv"))
  if (!file.exists(target)) {
    download.file(paste0("https://www.ncei.noaa.gov/data/global-summary-of-the-year/access/", s, ".csv"),
                  target, quiet = TRUE)
  }
})
writeLines("Annual summaries, one file per station.", file.path(folder, "about-the-csv-files.txt"))

list.files(folder, pattern = "*.csv")
## [1] "about-the-csv-files.txt" "USW00013874.csv"
## [3] "USW00023174.csv"         "USW00094728.csv"
list.files(folder, pattern = "\\.csv$")
## [1] "USW00013874.csv" "USW00023174.csv" "USW00094728.csv"
The glob-shaped pattern hands you a text file to parse as data. read_csv() will not complain about that in any useful way: it will read the readme as a one column table and stack it under your real data.
When the files do not all have the same columns
Real folders are ragged, and the one call version expects them not to be. It stacks the files by position, so it checks the column counts first and stops when they disagree.
files <- list.files(folder, pattern = "\\.csv$", full.names = TRUE)
names(files) <- basename(files)

read_csv(files, id = "file", show_col_types = FALSE)
## Error:
## ! Files must all have 106 columns:
## i File 2 has 80 columns.
map_int(files, \(f) ncol(read_csv(f, n_max = 0, show_col_types = FALSE)))
## USW00013874.csv USW00023174.csv USW00094728.csv
##             106              80             106
The stations do not measure the same things. Los Angeles reports 80 columns against New York’s 106, because it has no columns for freezing fog or snow depth days. Reading each file separately and binding by name fixes that, filling the missing columns with NA.
Why list_rbind() cannot combine <character> and <double>
Because every file’s column types were guessed independently, from that file’s own rows, so the same column can come back as two different types.
files |>
  map(\(f) read_csv(f, show_col_types = FALSE)) |>
  list_rbind(names_to = "file")
## Error in `list_rbind()`:
## ! Can't combine `USW00013874.csv$DSNW_ATTRIBUTES` <character> and `USW00023174.csv$DSNW_ATTRIBUTES` <double>.
That is not a corrupt file. DSNW_ATTRIBUTES is a quality flag, and it holds 0, 1, W, X in Atlanta but only 0 in Los Angeles, where it does not snow. One file’s flags look like text, the other’s look like a number, and list_rbind() refuses to guess which was meant.
The fix is to stop guessing per file. Read every column as character, bind the files, then run type_convert() once on the finished frame, so the types are decided on all the data at once rather than on whichever file happened to be first.
all_years <- files |>
  map(\(f) read_csv(f, col_types = cols(.default = col_character()))) |>
  list_rbind(names_to = "file") |>
  type_convert(guess_integer = FALSE)

dim(all_years)
## [1] 338 107
That is 338 station years across 107 columns, and DSNW_ATTRIBUTES is now character everywhere. The cost is that every file is parsed as text first, which is slower than letting vroom type the columns as it reads. For a few hundred megabytes it is not worth worrying about, and it is the version that does not break when someone adds a station.
It is worth being precise about why the per file guess goes wrong. Since readr 2.0.0 the guess is not taken from the first 1000 rows: guess_max values (1000 by default) are sampled evenly from the first row to the last, so the classic case of a column that is empty at the top and interesting at the bottom is already handled. What is not handled is that each file is typed on its own contents. DSNW_ATTRIBUTES really is all digits in Los Angeles and really does carry letter flags in Atlanta, so two correct guesses disagree and list_rbind() refuses them. Sampling still matters when a column’s informative values are rarer than the sample: a flag set in a handful of rows out of a million can miss all 1000 sampled values and be typed on the rest.
The combined data
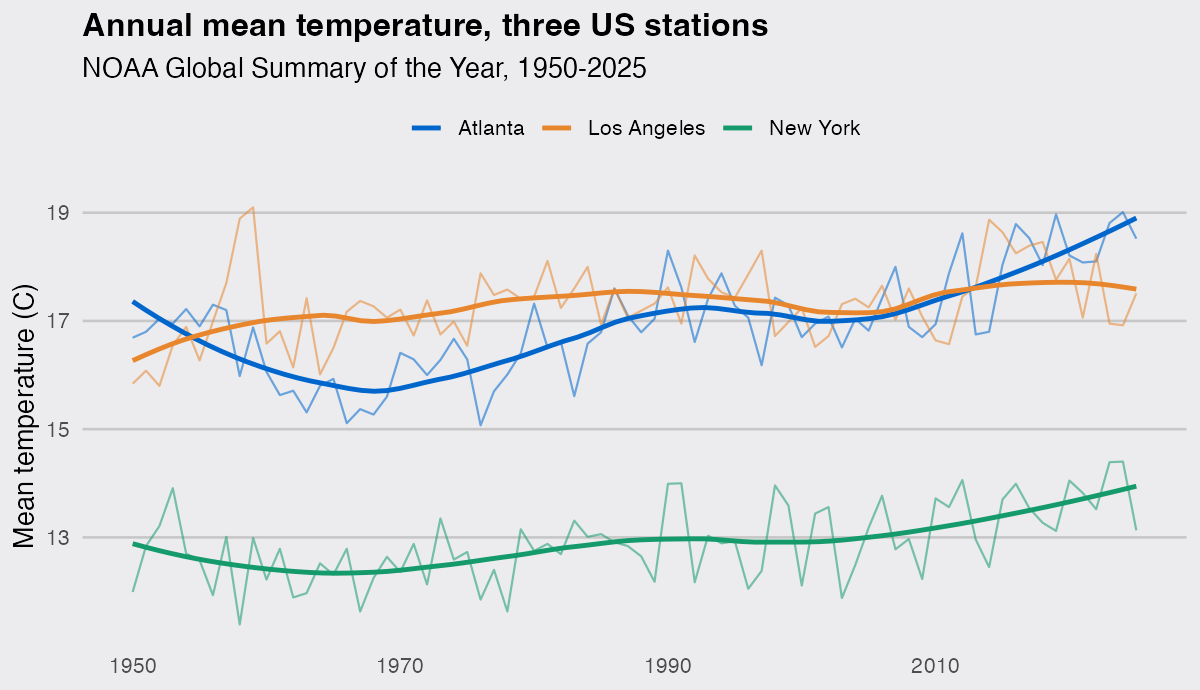
With the frame assembled, the payoff is ordinary dplyr on all three stations at once.
library(ggplot2)

dsp_colors <- c("#0066CC", "#E8862D", "#159A6C", "#7D5BD6",
                "#D64580", "#2AA9B8", "#C9A227")
dsp_theme <- theme_minimal(base_size = 13) +
  theme(plot.background    = element_rect(fill = "#ECECEF", color = NA),
        panel.background   = element_rect(fill = "#ECECEF", color = NA),
        panel.grid.minor   = element_blank(),
        panel.grid.major.x = element_blank(),
        panel.grid.major.y = element_line(color = "grey78"),
        axis.ticks         = element_blank(),
        plot.title         = element_text(face = "bold"),
        strip.text         = element_text(face = "bold"))

annual <- all_years |>
  filter(!is.na(TAVG), DATE >= 1950, DATE <= 2025) |>
  mutate(city = case_match(STATION,
                           "USW00094728" ~ "New York",
                           "USW00023174" ~ "Los Angeles",
                           "USW00013874" ~ "Atlanta"))

ggplot(annual, aes(DATE, TAVG, color = city)) +
  geom_line(linewidth = 0.5, alpha = 0.55) +
  geom_smooth(se = FALSE, method = "loess", span = 0.5, linewidth = 1.1, formula = y ~ x) +
  scale_color_manual(values = dsp_colors) +
  labs(title = "Annual mean temperature, three US stations",
       subtitle = "NOAA Global Summary of the Year, 1950-2025",
       x = NULL, y = "Mean temperature (C)", color = NULL) +
  dsp_theme +
  theme(legend.position = "top")
What to remember
Reading a folder of CSVs is one call when the files are uniform: read_csv(paths, id = "file"). When they are not, map() plus list_rbind() binds by name instead of by position, and reading as character with a single type_convert() at the end keeps one file’s quirks from deciding the whole frame’s types. And list the folder with "\\.csv$", because "*.csv" is a regex that will quietly hand you the readme.
Versions used here: R 4.6.1, readr 2.2.0, purrr 1.2.2, dplyr 1.2.1.

“It is worth knowing why the per file guess goes wrong so often. As of readr 2.2.0, guess_max defaults to min(1000, n_max), so types come from the first 1000 rows of each file.”
Not quite true. They’re evenly spaced in the file and always include the last line.
https://readr.tidyverse.org/articles/column-types.html#automatic-guessing
You’re right, thank you. I described the first edition parser: since readr 2.0.0 the guess takes
guess_maxvalues spread evenly from the first row to the last, which is exactly the case my sentence claimed would break. I’ve corrected the paragraph. The reason the files disagree here is not where the rows are sampled but that each file is typed on its own contents:DSNW_ATTRIBUTESis all digits in Los Angeles and carries letter flags in Atlanta, so both guesses are right about their own file andlist_rbind()still refuses them. Sampling only matters when a column’s informative values are rarer than the 1000 rows sampled.