
Sportsbet moved from fourth to first in our bookmaker leaderboard when we changed how ties earned credit. We kept the observations, qualification rules and denominators fixed, then calculated two versions of the score. The order changed because each version rewarded a different form of price leadership.
That decision carried weight across the sample. Two or more bookmakers shared the highest price in 1,328 of our 2,914 comparison groups, or 45.6%. A scoring rule applied to almost half the groups deserves an explicit calculation and a clear label beside the result.
Build the comparison, then calculate the score
Our WagerWise study contains 18,496 bookmaker observations from 15 Australian-facing feeds across 180 events scheduled from 17 to 21 February 2026 UTC. Those observations belong to 2,914 matched groups, with at least five bookmakers present in each group.
Every group matches the event, market, selection, exact line and one-hour pre-match checkpoint. A +6.5 spread and a +7.5 spread remain separate keys, even when the event and selection match. Matching the team name alone would combine prices for different selections and corrupt the comparison before scoring starts.
Once those groups are fixed, we can define the credit. The joint-highest measure gives one count to every bookmaker sharing the maximum price. Three bookmakers tied at the top each receive one count, recording three appearances at the highest quote.
Fractional credit allocates one point across the group. A unique leader receives one, two tied leaders receive 0.5 each, and three receive one-third each. The total credit stays at one regardless of how many bookmakers share the maximum.
That distinction matters when preparing aggregates. You cannot calculate fractional credit by dividing every shared appearance by two. Our sample includes 420 groups with at least three tied leaders. Their credits depend on the actual number sharing the maximum in each group.
At the group level, two checks keep the calculation honest: each bookmaker appears once, and the fractional credits sum to one. Duplicate rows can inflate both the numerator and denominator, while counting a tied leader twice can change the credit distributed to everybody else.
Install pandas and matplotlib, then run the example with the embedded CSV data. These aggregates contain each bookmaker's unique highest-price count, shared highest-price count, fractional credits and eligible comparison count.
The CSV stores qualifies_overall as a boolean flag. Read it with an explicit boolean dtype so the filter selects qualified bookmakers directly. That keeps the selection logic readable when somebody reruns the example or inspects the notebook.
Both rates use the same denominator: the number of groups containing that bookmaker. The joint-highest numerator adds unique and shared appearances; the fractional numerator uses the credits already calculated inside each group.
In Python, the difference comes down to two ratios:
from io import StringIO
import pandas as pd
import matplotlib.pyplot as plt

csv_data = """bookmaker_name,eligible_comparisons,unique_best_count,shared_best_count,best_price_credits,qualifies_overall
sportsbet,2424,441,215,520.5119048,True
dabble,1912,218,315,342.9785714,True
unibet,2439,50,719,367.8119048,True
tabtouch,2502,35,719,352.5785714,True
bet365,438,91,32,104.6261905,False
betr,968,155,179,225.7428571,False
pointsbet,1147,143,166,205.2690476,False
betright,912,109,138,161.5595238,False
playup,1508,127,266,227.3880952,False
ladbrokes,1725,114,246,202.7547619,False
wellbet,208,16,19,23.86666667,False
tab,1255,58,179,121.3285714,False
betnation,922,22,74,48.88333333,False
palmerbet,57,7,0,7.0,False
picklebet,79,0,4,1.7,False
"""

books = pd.read_csv(
    StringIO(csv_data),
    dtype={"qualifies_overall": "boolean"},
)
n = books["eligible_comparisons"]
assert n.gt(0).all()

books["At or jointly highest"] = (
    books["unique_best_count"] + books["shared_best_count"]
) / n
books["Fractional credit"] = books["best_price_credits"] / n

shown = books.loc[books["qualifies_overall"]].copy()
names = {"sportsbet": "Sportsbet", "dabble": "Dabble",
         "unibet": "Unibet", "tabtouch": "TABtouch"}
shown["label"] = [
    f"{names[r.bookmaker_name]} (n={r.eligible_comparisons:,})"
    for r in shown.itertuples()
]
rates = 100 * shown.set_index("label")[[
    "At or jointly highest", "Fractional credit"
]]
print(rates.round(1).to_string())

ax = rates.plot.barh(
    figsize=(9, 4), color=["#b45309", "#155e75"]
)
ax.invert_yaxis()
ax.set_xlabel("Rate among comparisons containing that bookmaker (%)")
ax.set_ylabel("")
ax.legend(frameon=False, loc="upper center", bbox_to_anchor=(0.5, 1.16), ncol=2)
plt.tight_layout()
plt.savefig("tie-scoring.png", dpi=180, bbox_inches="tight")
plt.close()
The assertion in the Python example checks that every bookmaker denominator is strictly positive. Keep that check close to the division so an empty comparison count fails before it becomes a score in the published table.
| Bookmaker | At or jointly highest | Fractional credit |
|---|---|---|
| Sportsbet | 27.1% | 21.5% |
| Dabble | 27.9% | 17.9% |
| Unibet | 31.5% | 15.1% |
| TABtouch | 30.1% | 14.1% |
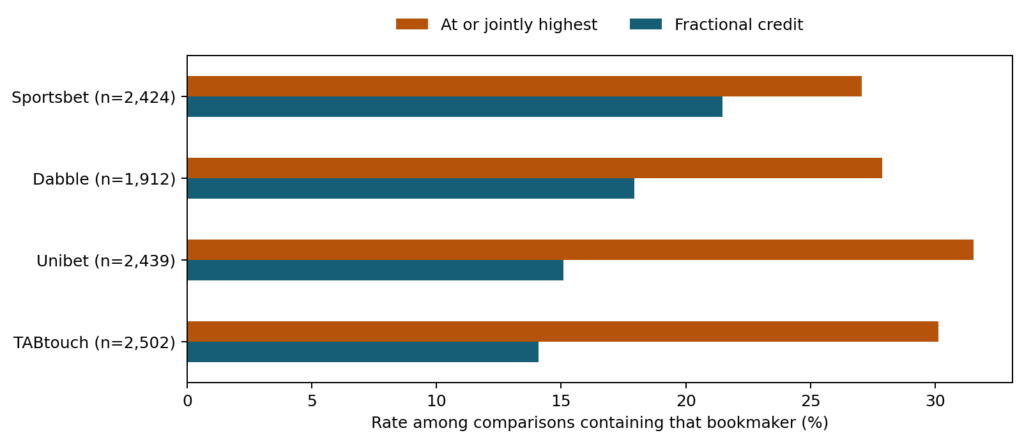
Unibet leads the joint-highest measure at 31.5%. Sportsbet leads fractional credit at 21.5%, moving from fourth to first among the four overall qualifiers. The two columns describe different aspects of the same recorded prices.
Sample sizes stay visible because coverage differs. Sportsbet appears in 2,424 comparisons, while Dabble appears in 1,912. Each bookmaker keeps its own denominator across both calculations. Adding the resulting percentages together would mix those denominators, so the bookmaker rates need not total 100%.
The display filter also needs careful placement. We calculated maximum prices and tie counts across all available feeds in each group, then displayed the four bookmakers meeting the study's overall qualification rules. Filtering the raw quotes to four bookmakers first would redefine the maximum and change which prices count as leaders.
Keep scoring separate from ranking
pandas.rank() assigns positions to the finished scores. The tie-credit calculation decides what goes into those scores. These operations happen at different levels: credit belongs to the matched price group, while rank belongs to the final bookmaker table.
Choosing method="min" gives equal final scores the same best rank. It doesn't allocate fractional credit inside a group. Apply the credit rule first, aggregate those credits, calculate the rates and then rank the finished values.
Keep full precision through those steps. Round the percentages for presentation after calculating the order. Ranking values already rounded to one decimal place can manufacture ties between scores that were different in the underlying calculation.
The chart follows the same discipline. Both measures use one percentage scale, and each bookmaker's comparison count appears beside its name. That lets readers compare the distance between the scores while seeing how much data supports each row.
Use the joint-highest rate to describe how often a bookmaker offered a highest quote, including shared leads. Use fractional credit to describe its share of best-price credit. Define that choice before sorting the table, and keep it visible when the chart is published.


