Python comes with functions and libraries that find hidden patterns and correlations amongst the data. You can use two essential functions, which are listed and discussed below, along with the code and syntax.
1.Dataframe.corr()
Usually, data are used in the form of dataframes while working in python which is supported by the pandas library. Pandas come with a function corr() which can be used in order to find relation amongst the various columns of the data frame.
Syntax :DataFrame.corr()
Returns:dataframe with value between -1 and 1
For details and parameter about the function check out Link
Let’s try this in action.
#import libraries
import numpy as np
import pandas as pd
import seaborn as sns
import matplotlib.pyplot
import time
% matplotlib inline
#read dataset
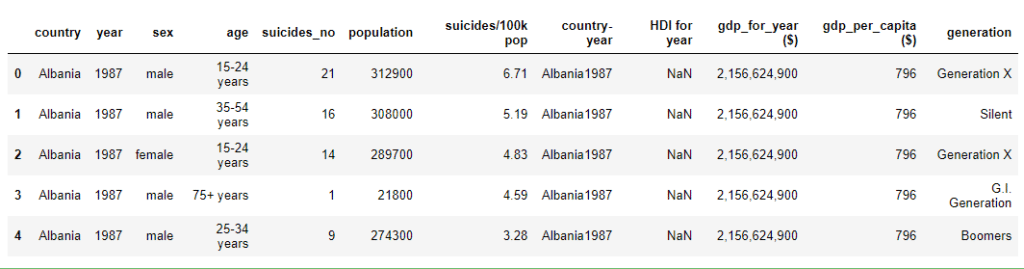
df=pd.read_csv("master.csv")
df.head()
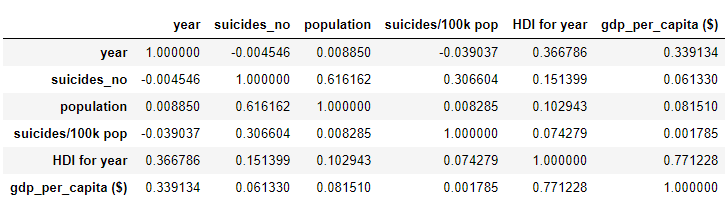
#calculation of the correlation matrix
df.corr()
#Calculating how much time is this function taking
start_time = time.time()
df.corr()
print("--- %s seconds ---" % (time.time() - start_time))

--- 0.006982088088989258 seconds ---
#visualization of the matrix using heatmap
sns.heatmap(df.corr(),annot=True)
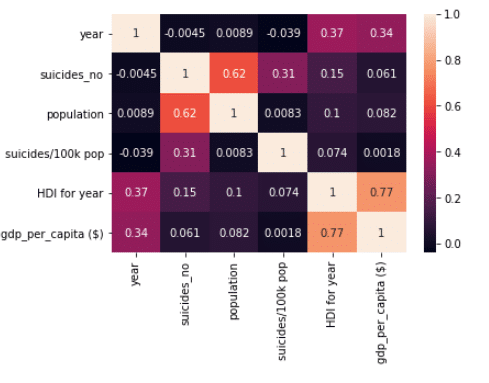
Few things to be observed about corr() are :
- Corr() function doesn’t consider categorical columns. It will automatically discard those columns.
- Corr() functions only tells the linear relationship between the columns. So if two columns have quadratic or higher degree relation it won’t be able to detect that.
- Corr() matrix is symmetrical along diagonal which means it assumes if column “A” affect column “B” by x factor then Column “B” will also affect column “A” by x factor.
- It is very fast in interpreting results.
So we can see that this function comes with some of its disadvantages. But these can be overcome by using PPS. Let’s get into that.
2.PPS(Predictive Power Score)
PPS(Predictive Power Score) is a library that comes up with a score that finds how attributes are dependent upon each other and it overcomes all the drawbacks that are faced while using core().
Syntax :ppscore.matrix(dataframe)
Returns:dataframe with a value between -1 and 1
Install ppscore library in your system using
pip install ppscore
Now let’s see how different it is from corr() function. We will be using same dataset which we used earlier.
#import libraries
import numpy as np
import pandas as pd
import seaborn as sns
import ppscore
%matplotlib inline

#Import dataset
df=pd.read_csv("master.csv")

#Calculating ppscore
c=ppscore.matrix(df)
#Calculating how much time is this function taking
start_time = time.time()
ppscore.matrix(df)
print("--- %s seconds ---" % (time.time() - start_time))

--- 166.11245608329773 seconds ---
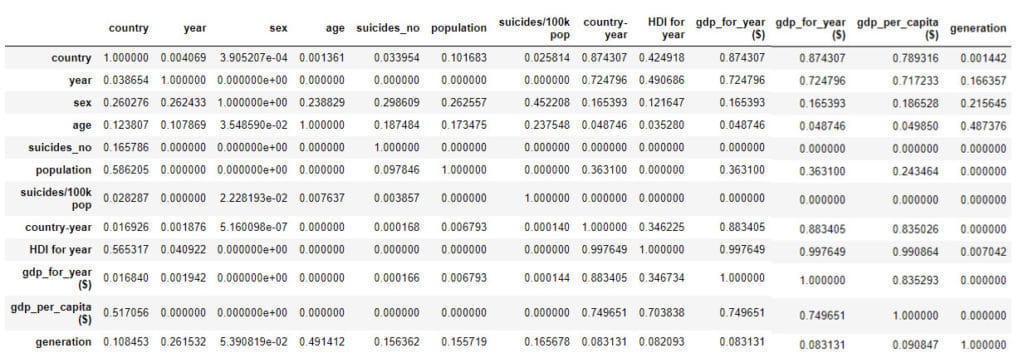
#visualization of the matrix using heatmap
sns.heatmap(ppscore.matrix(df))
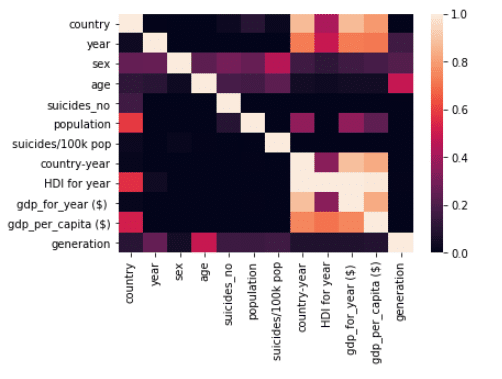
Few points we can draw from the above code and results:
- PPS consider categorical columns as well in order to find the relation among the data.
- It can identify relation other than linear like quadratic or logarithmic or any other.
- Unlike corr() its not symmetrical across the diagonal which means if column “A” has x impact on column “B” then column “B” may or may not have the same x impact on column ”A”.
- Lastly it is observed that ppscore takes much more time as compared to corr() as it has to go through a lot of complex calculations.
It’s important to note that if there is any other type of relations between two columns apart from linear then PPS can only identify or sense that it has some sort of relationship but it won’t be able to tell the user what exactly the relation is. It will just give numbers. Most of the people use corr() only as they are not aware of PPS. But PPS can help us a lot in identifying the details which are missed by corr(). So start using PPS.