K Means Clustering is an unsupervised machine learning algorithm which basically means we will just have input, not the corresponding output label. In this article, we will see it’s implementation using python.
K Means Clustering tries to cluster your data into clusters based on their similarity. In this algorithm, we have to specify the number of clusters (which is a hyperparameter) we want the data to be grouped into. Hyperparameters are the variables whose value need to be set before applying value to the dataset. Hyperparameters are adjustable parameters you choose to train a model that carries out the training process itself.
The K Means Algorithm is:
- Choose a number of clusters “K”
- Randomly assign each point to Cluster
- Until cluster stop changing, repeat the following
- For each cluster, compute the centroid of the cluster by taking the mean vector of the points in the cluster.
- Assign each data point to the cluster for which the centroid is closest
Choosing a K will affect what cluster a point is assigned to:

Finding a K-value
There is no easy answer for choosing k value.One of the method is known as elbow method.First of all compute the sum of squared error(SSE) for some value of K.SSE is defined as the sum of the squared distance between centroid and each member of the cluster. Then plot a K against SSE graph.We will observe that as K increases SSE decreases as disortation will be small. So the idea of this algorithm is to choose the value of K at which the graph decrease abruptly.This sort of produces a “elbow effect” in the picture.
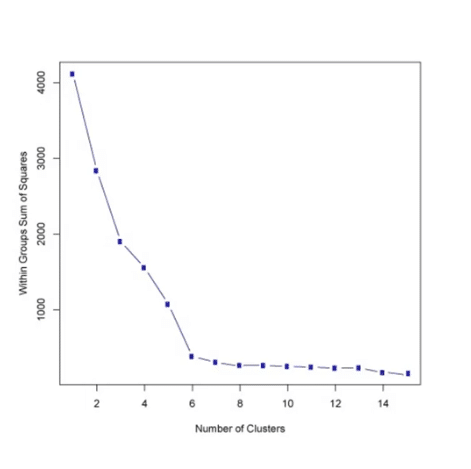
In the above picture we can see a elbow occuring around 6-7 so thats a good number to choose.
Python Code
Import libraries:
import seaborn as sns
import matplotlib.pyplot as plt
%matplotlib inline
Create some Data
Import library to create a dataset.In this we are creating a dummy dataset instead of importing real one.You can use this algorithm on any real dataset as well.
from sklearn.datasets import make_blobs
In this dataset we will have 300 sample points having 2 features and there are 5 center to this blob.
data = make_blobs(n_samples=300, n_features=2,
                           centers=5, cluster_std=1.8,random_state=101)
data[0].shape
(300, 2)
In the unsupervised learning we dont know the labels but since we are creating the dataset so we will have the label to compare the label given by the Algorithm versus the actual label.
data[1]
array([4, 0, 2, 4, 4, 0, 2, 2, 0, 3, 1, 0, 0, 2, 1, 1, 4, 4, 0, 1, 1, 4,
       4, 0, 0, 2, 1, 2, 2, 4, 0, 0, 4, 0, 0, 2, 2, 3, 3, 4, 4, 4, 2, 1,
       2, 1, 0, 4, 4, 4, 1, 1, 0, 4, 0, 3, 1, 0, 2, 3, 1, 1, 3, 1, 4, 4,
       4, 1, 1, 1, 2, 2, 1, 1, 4, 1, 3, 3, 3, 1, 3, 2, 3, 0, 2, 1, 1, 1,
       2, 0, 3, 2, 1, 2, 1, 4, 3, 0, 2, 3, 0, 4, 0, 0, 3, 3, 3, 4, 2, 2,
       2, 1, 0, 0, 0, 3, 4, 4, 1, 1, 2, 0, 3, 4, 1, 1, 1, 4, 4, 2, 3, 3,
       3, 3, 3, 3, 4, 1, 0, 0, 0, 4, 3, 4, 2, 3, 2, 1, 3, 3, 4, 4, 2, 3,
       1, 2, 4, 2, 1, 4, 2, 4, 4, 1, 3, 1, 0, 3, 0, 0, 0, 3, 1, 3, 2, 1,
       3, 0, 0, 4, 1, 2, 4, 2, 2, 0, 0, 0, 3, 4, 2, 0, 2, 3, 2, 3, 4, 0,
       2, 0, 3, 4, 2, 0, 3, 2, 0, 4, 3, 4, 4, 1, 2, 4, 1, 3, 1, 0, 3, 1,
       0, 2, 3, 0, 1, 3, 2, 4, 4, 3, 1, 3, 3, 4, 0, 0, 0, 2, 0, 2, 4, 1,
       1, 3, 4, 0, 2, 4, 2, 4, 1, 2, 3, 0, 3, 2, 1, 0, 0, 0, 2, 3, 2, 0,
       4, 2, 2, 1, 4, 1, 1, 1, 3, 3, 0, 4, 3, 3, 4, 1, 4, 3, 2, 0, 2, 4,
       1, 2, 4, 3, 2, 2, 1, 0, 3, 1, 3, 2, 1, 0])
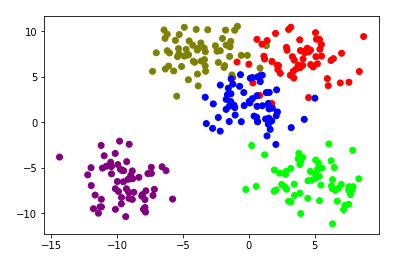
Data Visualize
Lets plot out this to get a better idea what actually we are doing here.
plt.scatter(data[0][:,0],data[0][:,1],c=data[1],cmap='brg')
Using K means Clustering
Here we will import the K means algorithm from scikit learn and we will define number of clusters we want to have for this dataset.
from sklearn.cluster import KMeans
Here we are doing it for n=5 (Number of clusters will be 5)
kmeans = KMeans(n_clusters=5)
Now,we need to fit the data for this or we can say we need to apply this algorithm to our dataset.
kmeans.fit(data[0])
KMeans(algorithm='auto', copy_x=True, init='k-means++', max_iter=300,
    n_clusters=5, n_init=10, n_jobs=None, precompute_distances='auto',
    random_state=None, tol=0.0001, verbose=0)
In case, you want to check out the center of the clusters.You the use the following line of code:
kmeans.cluster_centers_
array([[ 4.07267325,  7.01145994],
       [-9.46255618, -6.63414105],
       [-3.74000213,  7.61266002],
       [ 4.78617945, -6.4146509 ],
       [ 0.04663137,  2.09954982]])
The below line of code will report back the label it believe to be true for the cluster.
kmeans.labels_
array([3, 4, 0, 3, 4, 4, 0, 0, 4, 0, 1, 4, 4, 0, 1, 1, 3, 3, 0, 1, 1, 3,
       3, 4, 4, 0, 1, 0, 0, 3, 4, 4, 3, 4, 4, 0, 2, 2, 2, 3, 3, 3, 0, 1,
       4, 1, 4, 3, 3, 3, 1, 1, 4, 3, 4, 2, 1, 4, 0, 2, 1, 1, 2, 1, 3, 3,
       3, 1, 1, 1, 0, 0, 1, 1, 3, 1, 2, 2, 2, 1, 2, 4, 2, 4, 0, 1, 1, 1,
       0, 4, 2, 0, 1, 4, 1, 3, 2, 4, 0, 2, 4, 3, 4, 4, 2, 2, 2, 3, 0, 4,
       2, 1, 4, 4, 4, 4, 3, 3, 1, 1, 0, 4, 2, 3, 1, 1, 1, 3, 3, 0, 2, 2,
       2, 2, 2, 2, 3, 1, 4, 4, 4, 3, 2, 3, 0, 2, 0, 1, 2, 2, 3, 3, 0, 2,
       1, 0, 3, 0, 1, 3, 0, 3, 3, 1, 2, 1, 4, 2, 4, 4, 4, 2, 1, 2, 0, 1,
       2, 4, 4, 3, 1, 0, 3, 0, 0, 4, 4, 4, 2, 3, 0, 4, 0, 2, 0, 0, 3, 4,
       0, 3, 2, 3, 0, 4, 2, 0, 4, 3, 2, 3, 3, 1, 4, 3, 1, 2, 1, 4, 2, 1,
       4, 0, 2, 4, 1, 2, 0, 3, 3, 2, 1, 2, 2, 3, 4, 4, 4, 0, 4, 0, 3, 1,
       1, 2, 3, 4, 0, 3, 0, 3, 1, 0, 2, 4, 2, 0, 1, 4, 4, 4, 0, 2, 0, 4,
       3, 0, 0, 1, 3, 1, 1, 1, 2, 2, 4, 3, 2, 2, 3, 1, 3, 2, 0, 4, 0, 3,
       1, 0, 3, 2, 0, 0, 1, 4, 2, 1, 2, 0, 1, 4])
Now, something that is really important to keep in mind is if it was an actually unsupervised real dataset our work is done here. Since we have this artificial dataset with labels so we can compare the performance of the algorithm. We use K means Clustering not to predict the labels but to actually find the labels in your data.
So, now we will visualize both the actual labels of the data and the labels which are predicted by the algorithm by plotting them on graph.
f, (ax1, ax2) = plt.subplots(1, 2, sharey=True,figsize=(10,6))
ax1.set_title('K Means')
ax1.scatter(data[0][:,0],data[0][:,1],c=kmeans.labels_,cmap='brg')
ax2.set_title("Original")
ax2.scatter(data[0][:,0],data[0][:,1],c=data[1],cmap='brg')
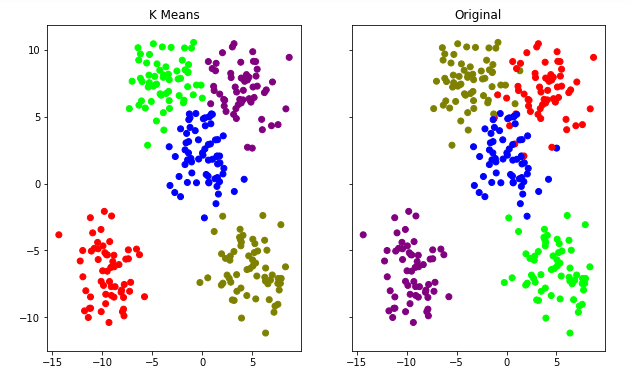
So we can see that the algorithm worked pretty well to make clusters for the above dataset. So you can try with other values of “K” and analyze which give a better result. Stay tuned for more fun!
Thank you.