I wanted a number I assumed was one line of R away: how many food recalls did the United States have in 2024 and 2025? The FDA publishes every enforcement report through the openFDA API, so I pulled the lot and counted the rows. I got 3,026. That answer is about three times too big, and nothing in the file flags it, because every one of those 3,026 rows really is unique. distinct() removes nothing. The repetition sits in a column I had not thought to group by.
Getting the recall reports
openFDA returns at most 1,000 records per request, so the pull is a small paging loop. This block runs on its own, with httr2 1.3.0 and R 4.6.1:
library(httr2)
library(dplyr)
library(purrr)

fda_page <- function(skip) {
  request("https://api.fda.gov/food/enforcement.json") |>
    req_url_query(search = "report_date:[20240101 TO 20251231]",
                  limit = 1000, skip = skip) |>
    req_perform() |>
    resp_body_json()
}

total <- fda_page(0)$meta$results$total

recalls <- map(seq(0, total - 1, by = 1000), \(s) fda_page(s)$results) |>
  list_flatten() |>
  map(\(r) as_tibble(r[c("event_id", "recall_number", "classification",
                         "recalling_firm", "reason_for_recall", "report_date")])) |>
  list_rbind()

nrow(recalls)
## [1] 3026
sum(duplicated(recalls))
## [1] 0
n_distinct(recalls$recall_number)
## [1] 3026
n_distinct(recalls$event_id)
## [1] 1036
Not one duplicate row, and recall_number is unique on every record. But event_id takes only 1,036 distinct values across 3,026 records. That is the whole story: the FDA files one record per recalled product, and event_id is the recall the products belong to.
How do I count unique groups instead of rows in R?
Use n_distinct() on the grouping key inside summarise(), which counts the groups rather than the rows that carry them.
recalls |>
  summarise(records = n(), events = n_distinct(event_id))
## # A tibble: 1 × 2
##   records events
##     <int>  <int>
## 1    3026   1036
The same call inside group_by() gives both counts per group, and the ratio between them is the interesting quantity: how many products a typical recall of that kind pulls off the shelf.
One Listeria recall, 86 rows
The largest recall event in the window is Fresh & Ready Foods LLC, which recalled ready-to-eat sandwiches and snack boxes in June 2025 after Listeria was found on food contact surfaces. It is 86 records, 2.8% of the whole two-year file, from a single recall.
count(recalls, event_id, name = "products") |>
  slice_max(products, n = 3)
## # A tibble: 3 × 2
##   event_id products
##   <chr>       <int>
## 1 96869          86
## 2 97019          83
## 3 94829          68
That is not a rare shape. 68.1% of recall events are a single product, the mean is 2.92 products, and the ten largest events supply 19.3% of all the records. Counting records means letting a handful of very wide recalls set the totals.
Counting records instead of events changes the answer
The reason a food is recalled is exactly where this bites, because the two big causes have very different widths.
recalls <- recalls |>
  mutate(reason = case_when(
    str_detect(tolower(reason_for_recall), "undeclared|allergen|label") ~ "Undeclared allergen or labeling",
    str_detect(tolower(reason_for_recall), "listeria|l\\. ?mono")       ~ "Listeria",
    str_detect(tolower(reason_for_recall), "salmonella")                ~ "Salmonella",
    str_detect(tolower(reason_for_recall), "foreign|metal|plastic|glass") ~ "Foreign material",
    str_detect(tolower(reason_for_recall), "e\\. ?coli|escherichia")    ~ "E. coli",
    TRUE                                                                ~ "Other"))

by_reason <- recalls |>
  group_by(reason) |>
  summarise(records = n(), events = n_distinct(event_id), .groups = "drop") |>
  mutate(products_per_event = round(records / events, 2),
         pct_records = round(100 * records / sum(records), 1),
         pct_events  = round(100 * events / sum(events), 1)) |>
  arrange(desc(events))

by_reason
## # A tibble: 6 × 6
##   reason                records events products_per_event pct_records pct_events
##   <chr>                   <int>  <int>              <dbl>       <dbl>      <dbl>
## 1 Undeclared allergen …     865    436               1.98        28.6       41.9
## 2 Other                     587    238               2.47        19.4       22.9
## 3 Listeria                  758    131               5.79        25         12.6
## 4 Salmonella                501    116               4.32        16.6       11.2
## 5 Foreign material          277    105               2.64         9.2       10.1
## 6 E. coli                    38     14               2.71         1.3        1.3
Counted as records, undeclared allergens (28.6%) barely lead Listeria (25.0%), and the two look like comparable halves of the American recall problem. Counted as recall events, allergens are 41.9% of everything and Listeria is 12.6%, so allergen recalls happen about 3.3 times as often. The gap between the two counts is the width of the recall: a Listeria recall covers 5.8 products on average and an undeclared-allergen recall 2.0. A mislabeled product is one product; a contaminated production line is everything that ran on it.
dsp_colors <- c("#0066CC", "#E8862D", "#159A6C", "#7D5BD6",
                "#D64580", "#2AA9B8", "#C9A227")
dsp_theme <- theme_minimal(base_size = 13) +
  theme(plot.background    = element_rect(fill = "#ECECEF", color = NA),
        panel.background   = element_rect(fill = "#ECECEF", color = NA),
        panel.grid.minor   = element_blank(),
        panel.grid.major.y = element_blank(),
        panel.grid.major.x = element_line(color = "grey78"),
        axis.ticks         = element_blank(),
        plot.title         = element_text(face = "bold"),
        strip.text         = element_text(face = "bold"))

by_reason |>
  select(reason, `Recall records` = pct_records, `Recall events` = pct_events) |>
  pivot_longer(-reason, names_to = "unit", values_to = "pct") |>
  ggplot(aes(pct, reorder(reason, pct), fill = unit)) +
  geom_col(position = position_dodge(width = 0.7), width = 0.65) +
  geom_text(aes(label = sprintf("%.0f%%", pct)), size = 3.6, color = "grey25",
            position = position_dodge(width = 0.7), hjust = -0.2) +
  scale_fill_manual(values = c("Recall records" = dsp_colors[1],
                               "Recall events"  = dsp_colors[2])) +
  scale_y_discrete(labels = \(x) str_wrap(x, 18)) +
  scale_x_continuous(limits = c(0, 48), expand = expansion(mult = c(0, 0.02))) +
  labs(title = "Why US food is recalled, counted two ways",
       subtitle = "FDA food enforcement reports, 2024 and 2025",
       x = "Share of total (%)", y = NULL, fill = NULL) +
  dsp_theme + theme(legend.position = "top")
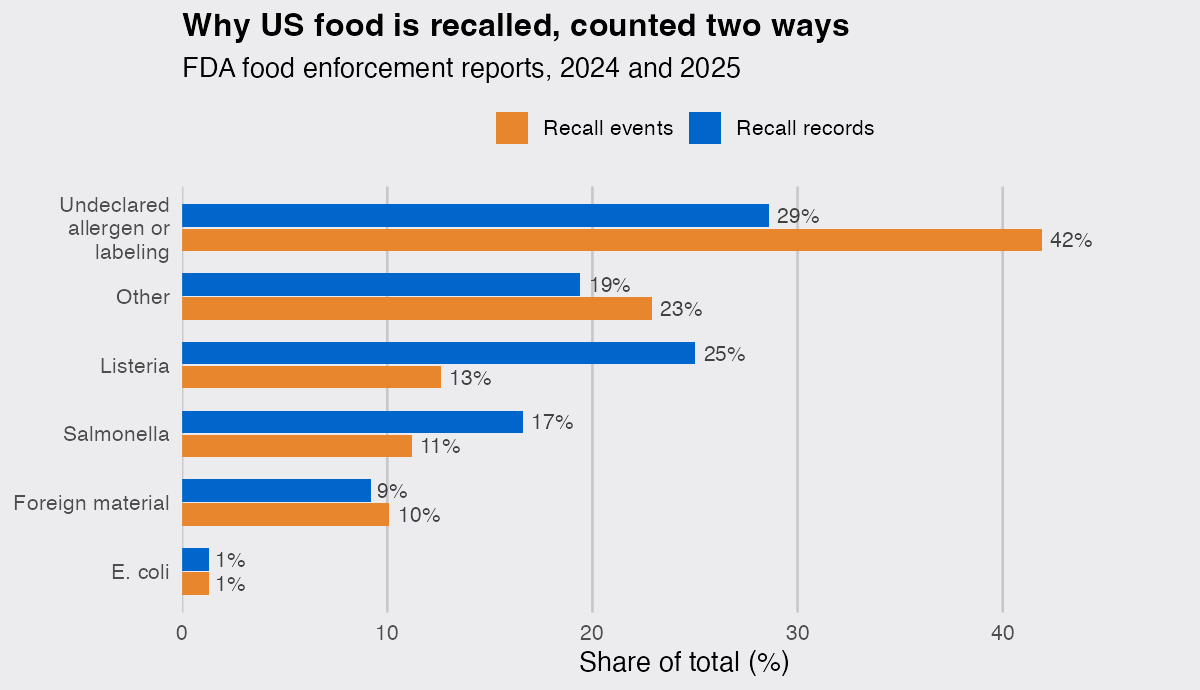
The severity label is on the product, not on the recall
Class I is the FDA’s serious category, the one where eating the food could hurt you. It is 41.9% of records but 38.8% of events, and the classification is assigned per product, so one recall can carry two of them.
recalls |>
  group_by(event_id) |>
  summarise(classes = n_distinct(classification), .groups = "drop") |>
  count(classes)
## # A tibble: 3 × 2
##   classes     n
##     <int> <int>
## 1       1  1009
## 2       2    26
## 3       3     1
27 events span more than one class, including the sandwich recall above, which is 85 Class I records and one Class II. Add up the per-class event counts and you get 1,064, more than the 1,036 events that exist. Categories that live on the row do not necessarily partition the groups.
One practical note on the date filter: report_date is the day the FDA publishes the enforcement report, and all 86 records of that sandwich recall share one. Splitting this window by publication year gives 461 events plus 575 events, which is exactly the 1,036 events in the pair of years, with none double counted. recall_initiation_date does not behave that way, so a date filter on it can cut an event in half.
These files cover FDA-regulated food only, so meat, poultry and egg products, which USDA handles, are not in the counts. What travels beyond this dataset is the check: before counting anything, ask what one row is. Here nrow() answers a question about products, n_distinct(event_id) answers a question about recalls, and only one of those is what a headline means by "recalls".


