
Recently I wanted to extract a table from a pdf file so that I could work with the table in R. Specifically, I wanted to get data on layoffs in California from the California Employment Development Department. The EDD publishes a list of all of the layoffs in the state that fall under the WARN act here. Unfortunately, the tables are available only in pdf format. I wanted an interactive version of the data that I could work with in R and export to a csv file. Fortunately, the tabulizer package in R makes this a cinch. In this post, I will use this scenario as a working example to show how to extract data from a pdf file using the tabulizer package in R.
The link to the pdf gets updated often, so here I’ve provided the pdf (link is below) as downloaded from the site on November 29, 2016:
Preview of the PDF (link is below):
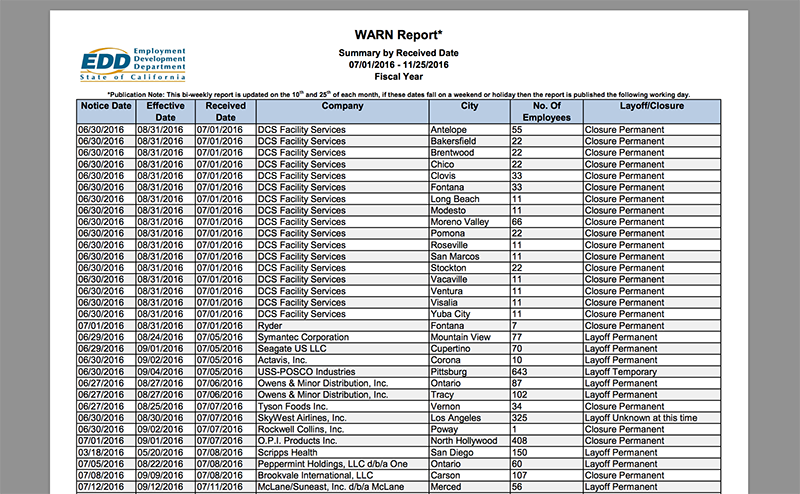
First, we will need to load the tabulizer package as well as dplyr.
library(tabulizer)
library(dplyr)
Next we will use the extract_tables() function from tabulizer. First, I specify the url of the pdf file from which I want to extract a table. This pdf link includes the most recent data, covering the period from July 1, 2016 to November 25, 2016. I am using the default parameters for extract_tables. These are guess and method. I’ll leave guess set to TRUE, which tells tabulizer that we want it to figure out the locations of the tables on its own. We could set this to FALSE if we want to have more granular control, but for this application we don’t need to. We leave the method argument set to “matrix”, which will return a list of matrices (one for each pdf page). This could also be set to return data frames instead.
# Location of WARN notice pdf file
location <- 'http://www.edd.ca.gov/jobs_and_training/warn/WARN-Report-for-7-1-2016-to-10-25-2016.pdf'

# Extract the table
out <- extract_tables(location)
Now we have a list object called out, with each element a matrix representation of a page of the pdf table. We want to combine these into a single data matrix containing all of the data. We can do so most elegantly by combining do.call and rbind, passing it our list of matrices. Notice that I am excluding the last page here. The final page is the totals and summary information. We don’t need that.
final <- do.call(rbind, out[-length(out)])
After doing so, the first three rows of the matrix contain the headers, which have not been formatted well since they take up multiple rows of the pdf table. Let’s fix that. Here I turn the matrix into a data.frame dropping the first three rows. Then I create a character vector containing the formatted headers and use that as the column names.
# table headers get extracted as rows with bad formatting. Dump them.
final <- as.data.frame(final[3:nrow(final), ])

# Column names
headers <- c('Notice.Date', 'Effective.Date', 'Received.Date', 'Company', 'City',
             'No.of.Employees', 'Layoff/Closure')

# Apply custom column names
names(final) <- headers
We now have a data.frame of all of the California layoffs. A quick glance at the first few rows:
head(final)
 Notice.Date Effective.Date Received.Date                Company         City No.of.Employees    Layoff/Closure
1  2016-06-30     2016-08-31    2016-07-01 DCS Facility Services     Antelope               55 Closure Permanent
2  2016-06-30     2016-08-31    2016-07-01 DCS Facility Services  Bakersfield               22 Closure Permanent
3  2016-06-30     2016-08-31    2016-07-01 DCS Facility Services    Brentwood               22 Closure Permanent
4  2016-06-30     2016-08-31    2016-07-01 DCS Facility Services        Chico               22 Closure Permanent
5  2016-06-30     2016-08-31    2016-07-01 DCS Facility Services       Clovis               33 Closure Permanent
6  2016-06-30     2016-08-31    2016-07-01 DCS Facility Services      Fontana               33 Closure Permanent
In order to manipulate the data properly , we will probably want to change the date column to a Date object as well as convert the No.of.Employees column to numeric. Here I do so using dplyr.
# These dplyr steps are not strictly necessary for dumping to csv, but useful if further data
# manipulation in R is required.
final <- final %>%
    # Convert date columns to date objects
    mutate_each(funs(as.Date(., format='%m/%d/%Y')), Notice.Date, Effective.Date, Received.Date) %>%
    # Convert No.of.Employees to numeric
    mutate(No.of.Employees = as.numeric(levels(No.of.Employees)[No.of.Employees]))
Last of all, I finish up by writing the final table to csv so that I can load it for later use.
# Write final table to disk
write.csv(final, file='CA_WARN.csv', row.names=FALSE)
I have found the tabulizer package to be wonderfully easy to use. Much of the process of extracting the data and tables from pdfs is abstracted away from the user. This was a very simple example, however if one requires more finely-tuned control of how tables are extracted, the extract_tables function has a lot of additional arguments to tweak to one’s liking. I encourage you to take a look for yourself.
You can find the code for this post on my Github.

I know this is a very old thread but here a potential solution.
You should try out this package called Pdf Data Extractor:
https://CRAN.R-project.org/package=PDE
It is free, has a user interface, allows to use of search words, only extracts tables, and will preserve the layout. Just start the
PDE_analyzer_i()function and then make sure under the table heading tab it matches your table heading if it is not a standard scientific paper.A detailed user guide can be found here:
https://cran.r-project.org/web/packages/PDE/vignettes/PDE.html
Thank you very much for this Troy!
I did chuckle when I noted that the 2019-2020 Warn Report Summary was incorrect 🙂 The results for the 2 columns where Closure and Layoff were unidentified had been added together. The filter by effective date had only been applied to the Notices Column, hence every other figure was incorrect when using the dates in the summary.
Here’s to you: https://github.com/IPI-Paul/IPI-R/tree/master/Extract%20PDF%20Tables
Hello Troy,
I try to do step by step, what you have done, but finally the columns Effective Date and Received Date are with NA? What am I doing wrong?
The function extract_tables (location) is not correct because in this step (out <- extract_tables (location)) the imported columns (only Effective Date and Received Date) delivered the time data in the form of "0 8/3 1/2 0 16" 0 6/3 0/2 0 16 "(with whitespace)!
thanks in advance …
location = “http://www.imea.com.br/upload/publicacoes/arquivos/06082018191629.pdf”
out <- extract_tables(location, pages = 2, encoding = "UTF-8")
I only seem to get the first few rows here. Any idea why?
Hi,
Very interesting post at first sight, only I get stuck at the line:
out <- extract_tables(location) with the message: Error in .jfindClass(as.character(class)) : class not found I already loaded packages like list, gamlss.dist, ... but all in vain. Maybe unnecessary to say, I'm a newbie in R ... Tnx for all help! Martin
Brilliant post – thanks Troy.
Please can you help me with the code where I have multiple pdfs, all with the same structure, which are saved in a local folder? I presume one would use merge_pdfs() but I’m not sure how..
Thanks
well, atm I’m not capable of doing something with the results … e.g. tabs[[2]] … , but I’m absolutely amazed at the quality of the text recognition …
I think Harry’s example PDF is a really complicated PDF …
Troy, or Harry …
thanks for the explanations .. I’m also new to R ..
I managed to try Harry’s FDA document … it takes some time, but hey, if you have to do everything manually, it will also take some time …
however … I checked Harry’s code with tabs[[1]] to see what I would get …
it turned out to be the “table of contents” … and: I don’t want to criticize, I just want to remark …
in my result, “table of content” was nowhere to be found … and neither “10 Points for Advisory Committee Discussion ” …
is that the idea of the function “extract_tables” ? … it does a lot of work for you, but “manual” checking is still necessary ? …
thanks in advance and best regards
Excellent package! Having a hard time installing on macOS Sierra 10.12.3 where “`install_github(“ropenscilabs/tabulizerjars”)“` fails with
“`JavaVM: requested Java version ((null)) not available. Using Java at “” instead.
JavaVM: Failed to load JVM: /bundle/Libraries/libserver.dylib
JavaVM FATAL: Failed to load the jvm library.
Error : .onLoad failed in loadNamespace() for ‘tabulizerjars’, details:
call: .jinit()
error: JNI_GetCreatedJavaVMs returned -1
Error: loading failed
Execution halted
ERROR: loading failed
* removing ‘/Library/Frameworks/R.framework/Versions/3.3/Resources/library/tabulizerjars’
Error: Command failed (1)“`
any ideas how to address?
Have you enabled Java support in R? On OSX don’t forget to run:
R CMD javareconf JAVA_CPPFLAGS=”-I/System/Library/Frameworks/JavaVM.framework/Headers -I$(/usr/libexec/java_home | grep -o ‘.*jdk’)”
from a terminal. Tabulizer requires Java, specifically rJava.
Hello,
I liked the tutorial, but i don’t understand what is ‘
final %>%’.
Anyone can explain?
Hi Sebastian. ‘%>%’ is the pipe operator from the magrittr package. It allows you to chain operations together in order to avoid the creation of intermediate objects. You can learn more about it at the magrittr vignette at:
https://cran.r-project.org/web/packages/magrittr/vignettes/magrittr.html
Hi Troy!
Let’s go huskies! Let’s go huskies!
CONGRATULATIONS! for your wonderful work done here!
Great job! Simple, precise and direct.
Great!
Let’s go huskies! Let’s go huskies!
HA
Any advice on why this is/isn’t better than pdftools package or tm:readPDF? (I haven’t used them, but I’ve heard of them, so wondering which one is best)
I have not used pdftools or rm::readPDF either. However it seems that tabulizer is particularly well-suited to extracting tables from pdfs, rather than just the pdf text and metadata itself. pdftools and readPDF do not appear to be quite adept at getting tables from pdfs. The one drawback to tabulizer compared to the other two packages is that it requires java.
I have not used pdftools or rm::readPDF either. However it seems that tabulizer is particularly well-suited to extracting tables from pdfs, rather than just the pdf text and metadata itself. pdftools and readPDF do not appear to be quite adept at getting tables from pdfs. The one drawback to tabulizer compared to the other two packages is that it requires java.
Error : .onLoad failed in loadNamespace() for ‘rJava’, details:
call: dirname(this$RuntimeLib)
error: a character vector argument expected
ERROR: lazy loading failed for package ‘tabulizerjars’
* removing ‘C:/Users/admin/Documents/R/win-library/3.3/tabulizerjars’
Error: Command failed (1)
> install_github(“ropenscilabs/tabulizer”)
Downloading GitHub repo ropenscilabs/tabulizer@master
from URL https://api.github.com/repos/ropenscilabs/tabulizer/zipball/master
Installing tabulizer
“C:/PROGRA~1/R/R-33~1.2/bin/x64/R” –no-site-file –no-environ –no-save –no-restore –quiet CMD INSTALL
“C:/Users/admin/AppData/Local/Temp/RtmpgBUX7y/devtools22705ebe731c/ropenscilabs-tabulizer-049265f” –library=”C:/Users/admin/Documents/R/win-library/3.3″
–install-tests
ERROR: dependency ‘tabulizerjars’ is not available for package ‘tabulizer’
* removing ‘C:/Users/admin/Documents/R/win-library/3.3/tabulizer’
Error: Command failed (1)
This looks like a terrific idea, if I can get it to work. For those of us still new to R, can you please describe how to fetch the Tabulizer package if R cannot find it in the CRAN repository? I’m using R 3.2.2
Check the comment from Harry!
Still makes no sense to a newbie. I have tried Harry’s code and still get errors. Did I say that I am a newbie?
The point is not *getting* an error, but *which*. You have to paste the error code, when you need help.
Everybody gets errors.
You might have to install.package(“devtools”) which is needed to use the install_github() function.
Harry’s code is correct and works for me.
@Harry: Thank you for pointing that out.
This is awesome!!! Much easier than fiddling with xpdf!
Warning in install.packages :
package ‘tabulizer’ is not available (for R version 3.3.2)
> install.packages(‘SchedulerR’)
Installing package into ‘C:/Users/junior.soares/Documents/R/win-library/3.3’
(as ‘lib’ is unspecified)
Warning in install.packages :
package ‘SchedulerR’ is not available (for R version 3.3.2)
Hi, Every package below in not available to install on R 3.3.2.
Se de error message:
install.packages(‘tabulizer’)
> install.packages(‘tabulizer’)
Installing package into ‘C:/Users/junior.soares/Documents/R/win-library/3.3’
(as ‘lib’ is unspecified)
Warning in install.packages :
package ‘tabulizer’ is not available (for R version 3.3.2)
Hi Junior,
The tabulizer package is not available from CRAN. You will need to install it from github using devtools as Harry states below. I will also add that you will need the correct version of Java installed on your machine as tabulizer uses the tabula-java package in Java.
Try with this :
install.packages(“ghit”)
ghit::install_github(c(“leeper/tabulizerjars”, “leeper/tabulizer”), INSTALL_opts = “–no-multiarch”)
This one worked for me. Thanks:)
Try Harry (comment (1)) way like this:
library(devtools)
install_github(“ropenscilabs/tabulizerjars”)
install_github(“ropenscilabs/tabulizer”)
library(tabulizer)
…..
……
I got the installation just right a couple of hours ago.
Just try it!
HA