Hope you liked the Part 1, Part 2, Part 3, and Part 4 of this series. In this Part 5, we are going to discuss tools used during the Control phase of Six Sigma DMAIC cycle. The aim of the control phase is to sustain the improvements achieved through the other stages of DMAIC cycle.The control phase in DMAIC is about controlling the “vital few” variables , which we identified during the earlier phases.
There are 2 scenario after Improve phase
1. Where Permanent process or the Design Changes implemented
This is the best type of improvements, as it requires no ongoing monitoring. For example – we identified that we need to increase the radius of the molded component, to reduce stress and cracking. We made the design changes and increase the radius of the mold. Here, the increased radius will stay till the life of tools, so no ongoing monitoring is required.
2. Where Permanent process or the Design Changes NOT implemented
In this case, where process changes cannot be made, error proofing should be implemented and should be monitored as a part of the quality process. For example, we identified new temperature setting during improve phase, temperature alarms need to be installed for the alert.
During the analyze phase, once vital few X’s ( variables that cause the variation in Ys of the process) have been identified, we need to control these Xs. If the variability of the Xs is under control, then the process will perform correctly, leading to the required Ys and, therefore, high-quality products.
Control Chart Selection
The control chart is used to monitor whether a process is in control or not. It is a time series graph with the process mean at center and the control limits on both sides of it. (Upper Control Limit & Lower Control Limit). The values lying outside the control limits show that the process is out of control. There are several other criteria with which the out-of-control nature of the process is detected.
The variation of the process can be attributed to two causes: Common Cause and Special cause. Common cause variation is the variation that is inherent in the process and no external factor can be associated with it. It is indeed very difficult to reduce this type of variation. Special cause variation is any variation that is caused by factors that are not a part of the process or system. These are normally outliers and can be easily detected. The use of a control chart helps one to distinguish between a common cause and a special cause.
The decision tree for selecting the right control chart is shown below
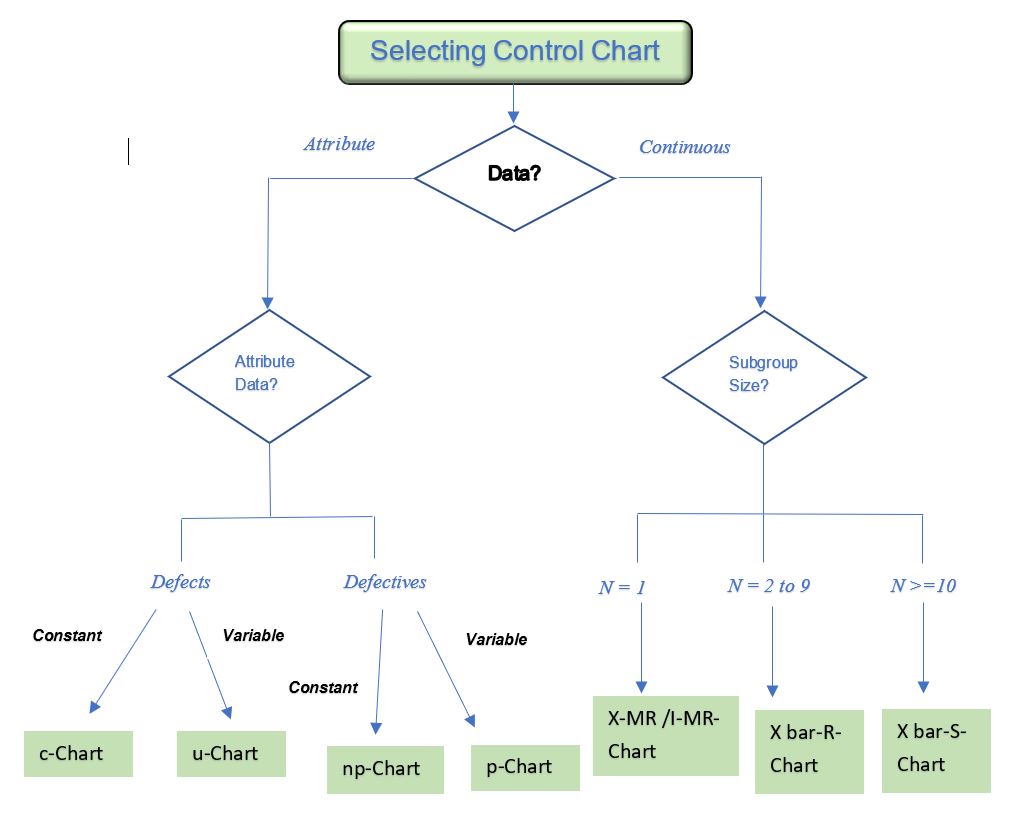
There are a certain set of Control chart rules that gives the indication that there are special causes of variation, mentioned in detail in this article
Variable & Attribute Control Charts in R
Variable Control Charts in R
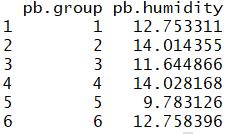
This type of chart is used for monitoring continuous variables. Central tendency & Variation is monitored. The sample data set from the qcc package contains values of humidity for each lot. To asses a lot of raw material received in the factory, we need to control individual values.
k=30 groups
qcc package can generate the control charts, by first creating the qcc objects and mentioning the type of control chart.
require(qcc)
head(ss.data.pb1)
pb.groups.one <- with(ss.data.pb1, qcc.groups(pb.humidity,
pb.group))
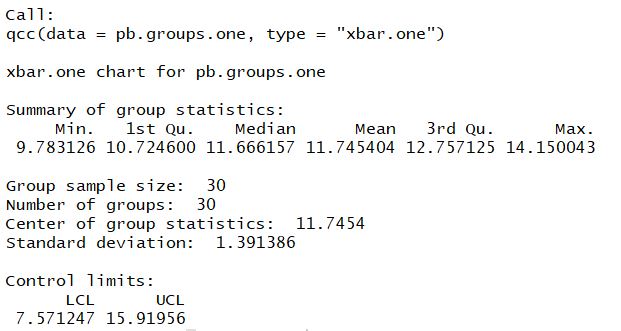
pb.xbar.one <- qcc(pb.groups.one, type="xbar.one")
summary(pb.xbar.one)
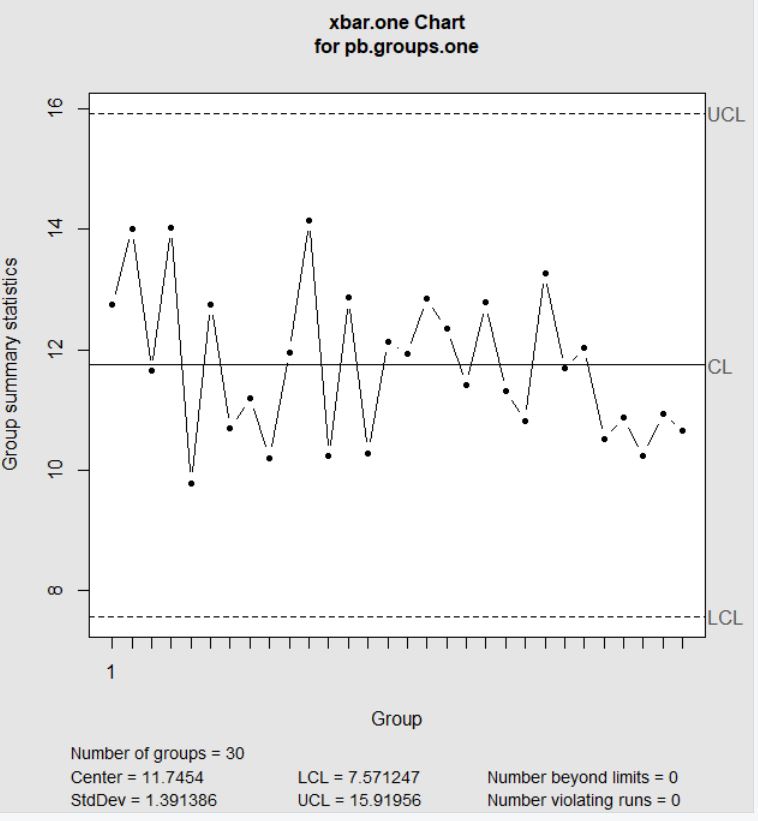
#Individual control chart- X-bar
plot(qcc(data = pb.groups.one,
         type = "xbar.one",
         center = pb.xbar.one$center,
         limits = pb.xbar.one$limits))
Attribute Control Charts in R
This type of chart is used for monitoring qualitative variables.
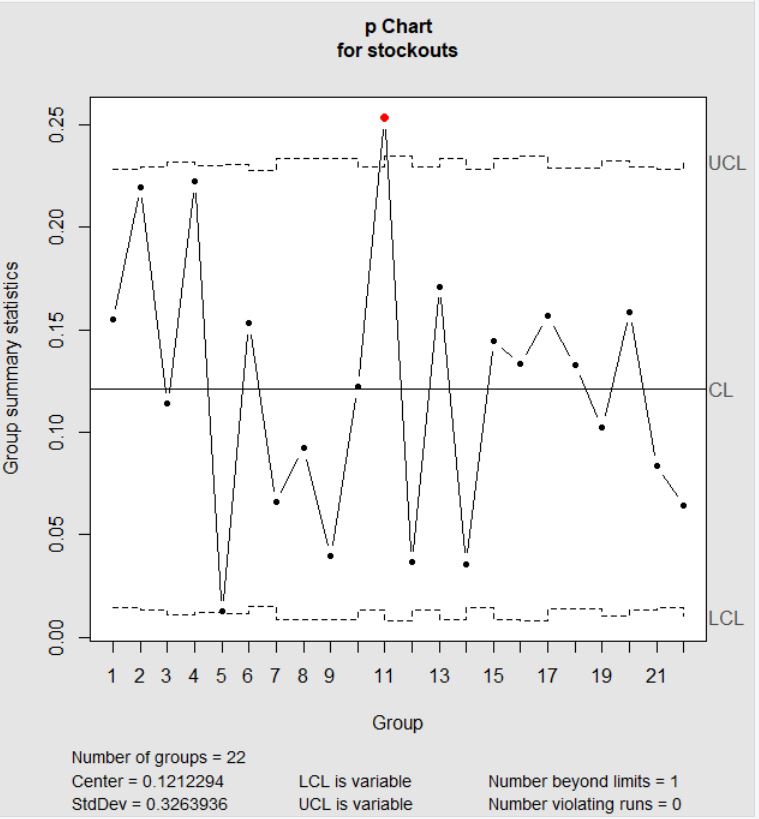
If we want to monitor & control proportion, the p-chart is used and If we want to monitor & control No. of defects per unit, u-chart is used.
library(SixSigma)
with(ss.data.pb3,head(ss.data.pb3))
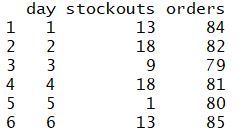
with(ss.data.pb3, plot(qcc(stockouts, orders, type ="p")) )
For u chart , enter “u” as the type argument. The data for u chart will consists of No. of defects per unit.
With this article, we completed Six Sigma DMAIC in R. This series is the brief introduction of How R programming language can be used for Six Sigma DMAIC process.
References
Please let me know your feedback in the comments section. Make sure to like & share it. Happy Learning!!