Hope you liked the Part 1 of this series. In this part, we will go through tools used in Measure phase of DMAIC cycle. In this phase, the baseline and target performance of the process must be determined and the measurement systems are validated. Two most representative tools during measure phase are: (1) Measurement system analysis (2) Process capability analysis
Measurement system analysis
Due to advancement in technology, manufacturing companies gather a large amount of data or information through measurement and inspection. The measurement data is required to be accurate if business persons are taking decisions about process based on this data. It is because just as any process have variation in the products it produced, the process of obtaining measurements may also have variation and can give you incorrect results.
From my personal experience, while working on Six Sigma Black Belt projects, I realized that for most of the projects, measurement system variation accounted for most of the variation in the CTQ. Sometimes, the project ended at the measurement phase, because the sigma level for the process improved drastically after the measurement system was fixed. So, MSA is very important in Measure phase, because if you can’t control the variability of your measurement system, the process can’t be controlled.
MSA, also known as gage R & R study is a thorough assessment of a measurement process, and typically includes a specially designed experiment that seeks to identify the components of variation in that measurement process. Gage R & R study quantifies three things:
-
– Repeatability: variation from the measurement instrument
– Reproducibility: variation from the individuals using the instrument
– Overall Gage R&R, which is the combined effect of (1) and (2)
The overall Gage R&R is normally expressed as a percentage of the tolerance for the CTQ being studied, and a value of 10% Gage R& R or less is considered acceptable in most cases.
There are 3 other concepts that need to be understood:
-
– Accuracy: How close is your test result to the accepted reference value.
– Trueness: How close is your average value obtained from a large series of test results and an accepted reference value.
– Precision: How precise is your independent test results obtained under stipulated conditions.
Data Collection for Gage R & R study
Randomly select the parts and assign them to the appraisers or operators or meters again randomly.
For example:
Suppose you have 3 piston rings, you take a measurement of diameters of these 3 piston rings by assigning to 2 different operators and each operator take 3 readings. So Total measurements = 3*2*3=18 measurements
Lets move to R and create data in R.
# Create gage R and R data for 3 piston rings , 2 operators and each operator 3 measurements per piston
Operator<- factor(rep(1:2, each = 9))
Pistonring<- factor(rep(rep(1:3, each = 3), 2))
run<- factor(rep(1:3, 6))
diameter<-c(1.4727, 1.4206, 1.4754, 1.5083, 1.5739,
               1.4341, 1.5517, 1.5483, 1.4614, 1.3337,
               1.6078, 1.4767, 1.4066, 1.5951, 1.8419,
               1.7087, 1.8259, 1.5444)
pistondata<-data.frame(Operator,Pistonring,run,diameter)
Perform Gage R & R in R using SixSigma Package in R.
#Load package
library("SixSigma")
#Perform gage R & R
my.rr <- ss.rr(var = diameter, part = Pistonring,
appr = Operator,
data = pistondata,
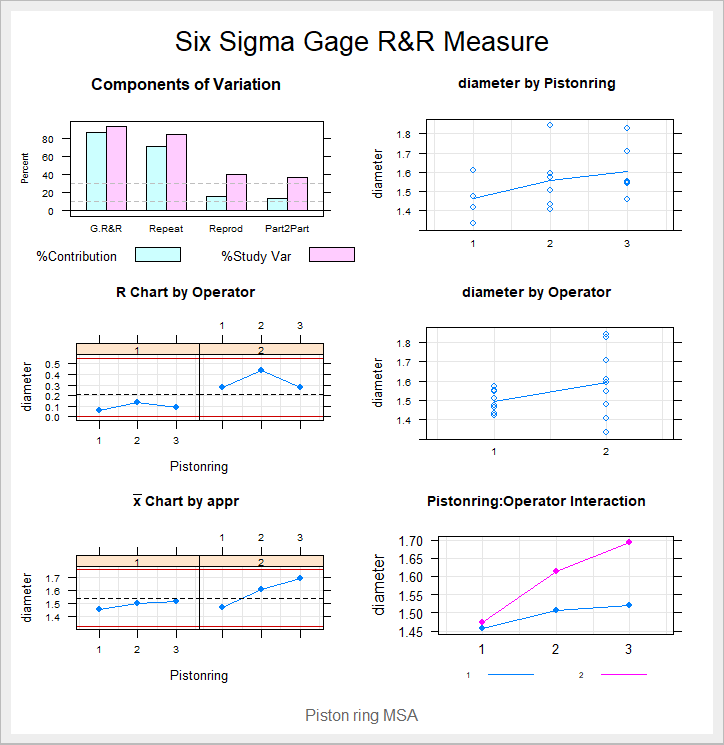
main = "Six Sigma Gage R&R Measure",
sub = "Piston ring MSA")
Gives this plot:
Interpretation of Charts
-
– Bar plot generated tell us the contribution of each component to the total variance. Thus we can detect that whether our measurement problem comes from the repeatability or reproducibility. Here, in the above plot, it can be seen that the process has problems with the repeatability and the reproducibility values, as their contribution is in both cases larger than 10%, with repeatability being approximately twice reproducibility.
– Strip plots and line plots representing the effects – whether the difference between operators or interaction between operators and piston ring is a problem. In the above plot, it can be seen that first piston ring has lower diameter than rest, but its variability is similar to that of the others, so this is not a problem for the measurement system.
However, the plot by operator shows apparent differences between the operators. So, this is a problem for our measurement system.
From interaction graph, as lines do not cross each other, so interaction between factors is irrelevant.
– Control charts (X-bar and R chart): All the points are within control limits in the X-bar chart. However, several points in the range control chart lie outside the limits. So, our measurement system is not working properly.
It is clear that our measurement system is not working properly and the main problem is the Operators. So, before proceeding further, we need to correct our measurement system by giving training to operators.
Process Capability analysis
Capability analysis is a very important tool in Measure phase. Since the output of a process is expected to meet customer requirements, specifications, or engineering tolerances. You can conduct a process capability study to determine the extent to which the process can meet these expectations.
The process capability is a measurable property of a process to the specification, expressed as Process capability Index Cpk.
Let’s create data for Process capability analysis in R. Let’s say you have 20 food samples with calories values.
# Create data for Process capability analysis
foodsample<-c(755.81, 750.54, 751.05, 749.52, 749.21, 748.38,
     748.11, 753.07, 749.56, 750.08, 747.16, 747.53,
     749.22, 746.76, 747.64, 750.46, 749.27, 750.33,
     750.26, 751.29)
Cp and Cpk
Cp is a measure of process capability that compares the specification width (USL – LSL) to the total process variation (6σ) for a given process or product parameter. The higher the Cp value, the more potential a process has to fit inside specification limits. The equation for Cp is Cp= (USL-LSL)/(6σ)
Cpk is very useful because it takes variation (σ) and position (X̄) into account versus upper and lower specification limits. If the mean is closer to the upper specification limit (USL), then Cpk is (USL-X̄)/(3σ). If the mean is closer to the lower specification limit (LSL), Cpk is (X̄ – USL)/(3σ)
For a perfectly centered process, Cp = Cpk
In the foodsample example (after setting LSL=740 and USL=760), lets calculate Cp and Cpk using Sixsigma package :
ss.ca.cp(x,740, 760)
1.584136
ss.ca.cpk(x,740, 760)
1.546513
Process capability of the current process is acceptable but we can improve the process to six sigma level (increasing Cpk=1.67)
By adding ci=TRUE, we can add confidence intervals
ss.ca.cp(x, 740, 760, ci = TRUE)
[1] 1.084600 2.083046
ss.ca.cpk(x, 740, 760, ci = TRUE)
[1] 1.033560 2.059466
Full Capability study with graphical output can be performed with SixSigma package.
# perform Capability Study
ss.study.ca(x, LSL = 740, USL = 760,
Target = 750, alpha = 0.5,
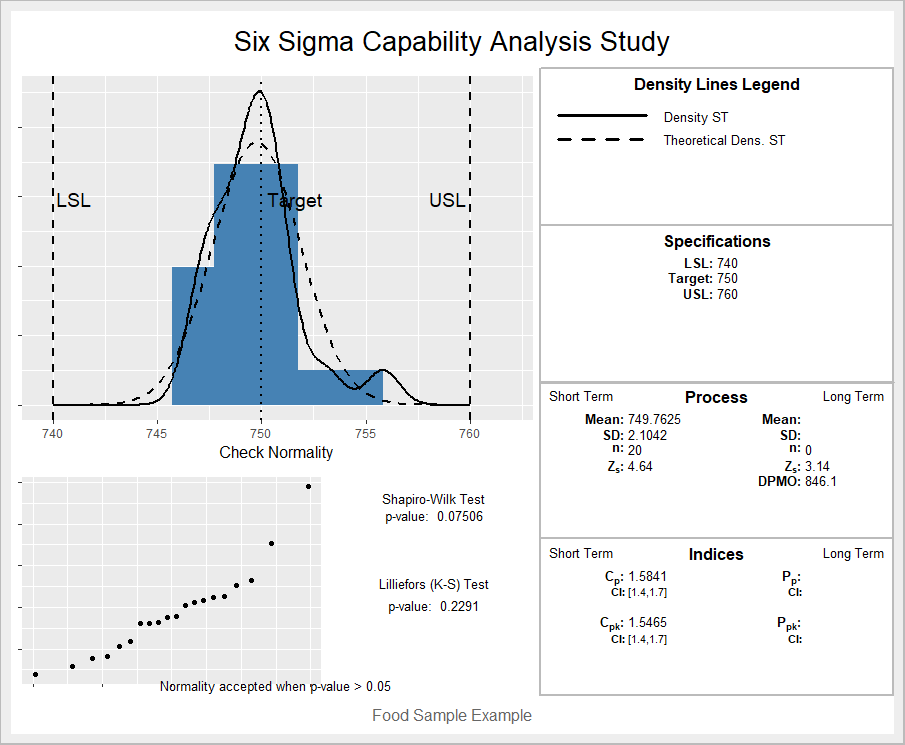
f.su = "Food Sample Example")
Gives this plot :
Interpretation of Plot
-
– The top chart is a histogram of the sample data, which includes the target and the specification limits. Density lines are plotted for the empirical and theoretical density functions.
– The bottom chart is a quantile-quantile chart (Q–Q plot) to verify if the data are normally distributed. When they are, the points are approximately on a straight line. In addition, the most common numerical tests are shown as well. Normality is accepted when the p-value of the hypothesis test is larger than 0.05. In the above food sample example , data is normal as p-value is higher than 0.05.
– The process performance and the indices are calculated with the short-term and long-term data provided. For long-term data, it also shows Pp and Ppk values. In this example, we have no long-term data. Capability index (1.547) is quite acceptable, though it can be improved to reach the desired 1.67 value ( for 6 sigma process).
Conclusion
To conclude, it’s important to correct your measurement system before proceeding further in the project and to know your current performance so that you can set the objective. Measurement System analysis helps in identifying the components of variation in process and Process capability analysis determine the extent to which the process can meet the specification limits.I intentionally didn’t cover all the concepts in process capability such as Z, DPMO, DPU/etc , as it would become more mathematical , whereas my intent was to focus on application in R.
In next part we will go through Analyze Phase, where we will learn about How we identify the causes for the problem.
References
Please let me know your feedback in the comments section. Make sure to like & share it. Happy Learning!!