In this post, I will present a simple way to export your regression results (or output) from R into Microsoft Word. Previously, I wrote a tutorial on how to create Table 1 with study characteristics and export it into Microsoft Word. These posts are especially useful for researchers who are preparing their manuscript for publication in a peer-reviewed journal.
Get the results from a Cox regression analysis
As an example to illustrate this post, I will run a survival analysis. Survival analysis is a group of statistical methods for analyzing data where the outcome variable is the time until the occurrence of an event. The event can be the occurrence of a disease, death, etc. In R, we perform survival analysis with the survival package; the function for Cox regression analysis is coxph(). I will use the veteran dataset, which comes with the survival package.
## Load survival package
library(survival)
# Load veteran data
data(veteran)
# Data description
help(veteran, package="survival")
# Show first 6 rows
head(veteran)
  trt celltype time status karno diagtime age prior
1   1 squamous   72      1    60        7  69     0
2   1 squamous  411      1    70        5  64    10
3   1 squamous  228      1    60        3  38     0
4   1 squamous  126      1    60        9  63    10
5   1 squamous  118      1    70       11  65    10
6   1 squamous   10      1    20        5  49     0

trt:	1=standard 2=test
celltype:	1=squamous, 2=smallcell, 3=adeno, 4=large
time:	survival time
status:	censoring status
karno:	Karnofsky performance score (100=good)
diagtime:	months from diagnosis to randomisation
age:	in years
prior:	prior therapy 0=no, 1=yes
Now let’s say that we are interested in the risk of dying (status) for the different cell types (celltype) and treatments (trt), adjusting for the other variables (karno, age, prior, diagtime).
This is the model:
# Fit the COX model
fit = coxph(Surv(time, status) ~ age + celltype + prior + karno + diagtime + trt, data=veteran)
And the output:
summary(fit)
Call:
coxph(formula = Surv(time, status) ~ age + celltype + prior +
    karno + diagtime + trt, data = veteran)

  n= 137, number of events= 128

                        coef  exp(coef)   se(coef)      z Pr(>|z|)
age               -8.706e-03  9.913e-01  9.300e-03 -0.936  0.34920
celltypesmallcell  8.616e-01  2.367e+00  2.753e-01  3.130  0.00175 **
celltypeadeno      1.196e+00  3.307e+00  3.009e-01  3.975 7.05e-05 ***
celltypelarge      4.013e-01  1.494e+00  2.827e-01  1.420  0.15574
prior              7.159e-03  1.007e+00  2.323e-02  0.308  0.75794
karno             -3.282e-02  9.677e-01  5.508e-03 -5.958 2.55e-09 ***
diagtime           8.132e-05  1.000e+00  9.136e-03  0.009  0.99290
trt                2.946e-01  1.343e+00  2.075e-01  1.419  0.15577
---
Signif. codes:  0 ‘***’ 0.001 ‘**’ 0.01 ‘*’ 0.05 ‘.’ 0.1 ‘ ’ 1

                  exp(coef) exp(-coef) lower .95 upper .95
age                  0.9913     1.0087    0.9734    1.0096
celltypesmallcell    2.3669     0.4225    1.3799    4.0597
celltypeadeno        3.3071     0.3024    1.8336    5.9647
celltypelarge        1.4938     0.6695    0.8583    2.5996
prior                1.0072     0.9929    0.9624    1.0541
karno                0.9677     1.0334    0.9573    0.9782
diagtime             1.0001     0.9999    0.9823    1.0182
trt                  1.3426     0.7448    0.8939    2.0166

Concordance= 0.736  (se = 0.03 )
Rsquare= 0.364   (max possible= 0.999 )
Likelihood ratio test= 62.1  on 8 df,   p=1.799e-10
Wald test            = 62.37  on 8 df,   p=1.596e-10
Score (logrank) test = 66.74  on 8 df,   p=2.186e-11
As we can see, there are “a lot” of results. In a manuscript, we often report only the hazard ratio and the 95% confidence interval, and only for the variables of interest. In this case, I am interested in cell type and treatment. Note: I will not comment on the regression coefficients, since that is not the aim of this post.
Prepare the table by creating the columns
First, I extract the hazard ratios, confidence intervals, and p-values from the fitted model and bind them together into a data frame.
# Prepare the columns
HR <- round(exp(coef(fit)), 2)
CI <- round(exp(confint(fit)), 2)
P <- round(coef(summary(fit))[,5], 3)
# Names the columns of CI
colnames(CI) <- c("Lower", "Higher")
# Bind columns together as dataset
table2 <- as.data.frame(cbind(HR, CI, P))
table2
                 HR Lower Higher     P
age               0.99  0.97   1.01 0.349
celltypesmallcell 2.37  1.38   4.06 0.002
celltypeadeno     3.31  1.83   5.96 0.000
celltypelarge     1.49  0.86   2.60 0.156
prior             1.01  0.96   1.05 0.758
karno             0.97  0.96   0.98 0.000
diagtime          1.00  0.98   1.02 0.993
trt               1.34  0.89   2.02 0.156
Select the variables of interest from the table
As I mentioned earlier, I am interested in only two variables (cell type and treatment). With the code below, I select those variables.
# select variables you want to present in table
table2 <- table2[c("celltypesmallcell","celltypeadeno","celltypelarge","trt"),]
table2
                HR Lower Higher     P
celltypesmallcell 2.37  1.38   4.06 0.002
celltypeadeno     3.31  1.83   5.96 0.000
celltypelarge     1.49  0.86   2.60 0.156
trt               1.34  0.89   2.02 0.156
Format the table
In a manuscript, we present the confidence intervals within brackets. Therefore, with the code below I add the brackets.
# add brackes and line for later use in table
table2$a <- "("; table2$b <- "-"; table2$c <- ")"

# order the columns
table2 <- table2[,c("HR","a","Lower","b","Higher","c", "P")]
table2
                 HR a Lower b Higher c     P
celltypesmallcell 2.37 (  1.38 -   4.06 ) 0.002
celltypeadeno     3.31 (  1.83 -   5.96 ) 0.000
celltypelarge     1.49 (  0.86 -   2.60 ) 0.156
trt               1.34 (  0.89 -   2.02 ) 0.156
Finalize the table and make it ready for Microsoft Word
The table is almost ready. Now I will merge the estimates into one column by using the unite() function from the tidyr package.
# Merge all columns in one
library(tidyr)
table2 = unite(table2, "HR (95%CI)", c(HR, a, Lower, b, Higher, c), sep = "", remove=T)
# add space between the estimates of HR and CI
table2[,1] <- gsub("\\(", " (", table2[,1])
table2
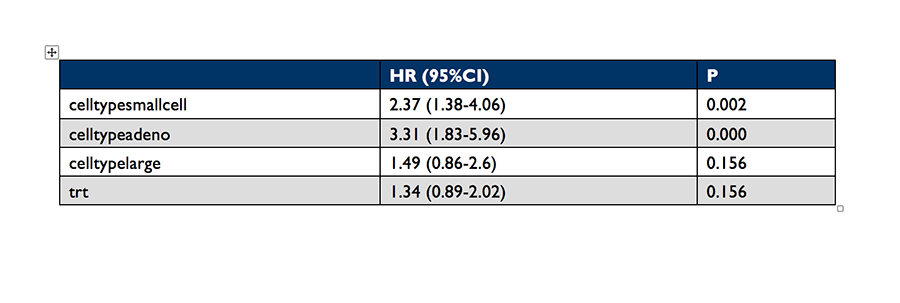
HR (95%CI) P
celltypesmallcell 2.37 (1.38-4.06) 0.002
celltypeadeno 3.31 (1.83-5.96) 0.000
celltypelarge 1.49 (0.86-2.6) 0.156
trt 1.34 (0.89-2.02) 0.156
Export the table from R to Microsoft Word
To export the table from R to Microsoft Word, I use the function FlexTable() from the ReporteRs package. I found a very good script on StackOverflow to achieve this task, and I am sharing the code below (credits to the author on StackOverflow).
# Load the packages
library(ReporteRs)
library(magrittr)
# The script
docx( ) %>%
     addFlexTable(table2 %>%
               FlexTable(header.cell.props = cellProperties( background.color = "#003366"),
                    header.text.props = textBold(color = "white"),
                    add.rownames = TRUE ) %>%
               setZebraStyle(odd = "#DDDDDD", even = "#FFFFFF")) %>%
     writeDoc(file = "table2.docx")
Running this code creates the file table2.docx in your working directory. This is the table in Microsoft Word:
If you have any comments or feedback, feel free to post a comment below.
Very well written. As an alternative if I might add one can have the 2 columns representing the CI, transformed into a single column consisting of string values. Afterwards through R2wd one can export any data.frame/matrix object as a table into word.
For quickly generating markdown tables (eg to be converted to docx/PDF/HTML in R markdown), you can directly pass the “coxph” object to “pander”, eg
> pander::pander(fit)
---------------------------------------------------------------------------
coef exp(coef) se(coef) z p
----------------------- --------- ----------- ---------- -------- ---------
**age** -0.008706 0.9913 0.0093 -0.9361 0.3492
**celltypesmallcell** 0.8616 2.367 0.2753 3.13 0.00175
**celltypeadeno** 1.196 3.307 0.3009 3.975 7.046e-05
**celltypelarge** 0.4013 1.494 0.2827 1.42 0.1557
**prior** 0.007159 1.007 0.02323 0.3082 0.7579
**karno** -0.03282 0.9677 0.005508 -5.958 2.553e-09
**diagtime** 8.132e-05 1 0.009136 0.008901 0.9929
**trt** 0.2946 1.343 0.2075 1.419 0.1558
---------------------------------------------------------------------------
Table: Fitting Proportional Hazards Regression Model: Surv(time, status) ~ age + celltype + prior + karno + diagtime + trt
Likelihood ratio test=62.1 on 8 df, p=1.798941e-10 n= 137, number of events= 128
Thanks Gergely. Is possible to customize the table with pander and to make the table as I did in this post?
Well, you can of course customize the table before passing to “pander”, eg you can call it on your “table2” object:
> pander(table2, justify = 'left', style = 'simple')
HR (95%CI) P
----------------------- ---------------- -----
**celltypesmallcell** 2.37 (1.38-4.06) 0.002
**celltypeadeno** 3.31 (1.83-5.96) 0
**celltypelarge** 1.49 (0.86-2.6) 0.156
**trt** 1.34 (0.89-2.02) 0.156
nice, thanks.
Thank you for this post. Very helpful because I use R but I am not an expert.
I have an issue with two things.
The first one is about the space between HR and CI. The function
table2[,1] <- gsub("(", " (", table2[,1]) shows an error: Error: '(' is an unrecognized escape in character string starting ""("
How can I fix it?
The second part is the docx function (to export table to a document).
Error in eval(expr, envir, enclos) : could not find function "docx"
I appreciate any help. Thank you. .
Answer for first question: should be \( instead of (
About your second question, make sure you install those 2 libraries.
Thank you. I could fix the first issue.
BTW, how can I put p values in the table? I know the concern about p
values nowadays, but I would like to print those values in the table.
The second issue is still present after installing packages (ReporterR, ReporteRsjars, rJava):
> library(ReporteRs)
Loading required package: ReporteRsjars
Error : .onLoad failed in loadNamespace() for ‘rJava’, details:
call: fun(libname, pkgname)
error: JAVA_HOME cannot be determined from the Registry
In addition: Warning message:
package ‘ReporteRs’ was built under R version 3.2.4
Error: package ‘ReporteRsjars’ could not be loaded
Script:
> docx( ) %>%
+ addFlexTable(table2 %>%
+ FlexTable(header.cell.props = cellProperties( background.color = “#003366”),
+ header.text.props = textBold(color = “white”),
+ add.rownames = TRUE ) %>%
+ setZebraStyle(odd = “#DDDDDD”, even = “#FFFFFF”)) %>%
+ writeDoc(file = “table2.docx”)
Error in eval(expr, envir, enclos) : could not find function “docx”
I have installed packages and checked versions. Not sure how to export the table to docx.
I appreciate your help.
Thanks!!
Thanks for the comment about P value. I agree with you and added in the table. I don’t know the errors you get when install the package, check your R or R studio settings.
you should install the rJava package when load the ReporteRs package.so alse you should install Java envirnment in your computer.
Nice article, thanks. Do you know the broom package? https://cran.r-project.org/web/packages/broom/vignettes/broom.html
It’ll make table preparation easier I think.
Exactly what I came in to write 🙂
Go check out the broom package!
We’re a good advertising team for broom 😉
Thanks for sharing!