
In 2016 a developer pulled an 11-line JavaScript package called left-pad from npm, and builds broke for projects as large as React and Babel. I wondered how exposed R is to the same thing: if one package left CRAN, how much of the repository would stop installing? On a frozen copy of CRAN from 1 October 2026, 13,513 of the 25,285 packages (53.4%) cannot be installed without rlang, and 8 more packages each sit underneath more than 40% of CRAN. In October 2017 no package reached 40%, and rlang reached 19%. The count most people look at, the list of direct dependents on a package’s CRAN page, misses most of this.
How do I find every package that depends on an R package?
Use tools::package_dependencies() with reverse = TRUE and recursive = TRUE, pointed at the package index from available.packages(). With the default recursive = FALSE you get only the packages that name it directly, which is also what the "Reverse imports" list on a CRAN page shows. This runs in base R (4.6.1 here), no packages needed:
ap <- available.packages(
  repos   = "https://packagemanager.posit.co/cran/2026-10-01",  # CRAN as of 1 Oct 2026
  type    = "source",
  filters = "duplicates"                                      # every package, any OS
)

direct   <- tools::package_dependencies("rlang", db = ap, reverse = TRUE)
everyone <- tools::package_dependencies("rlang", db = ap, reverse = TRUE, recursive = TRUE)

c(direct = length(direct$rlang), including_indirect = length(everyone$rlang), on_cran = nrow(ap))
##             direct including_indirect            on_cran
##               3917              13513              25285
The repository URL is Posit Package Manager‘s snapshot of CRAN for that date, so the numbers will not drift; use https://cloud.r-project.org for today’s CRAN instead. filters = "duplicates" keeps packages built for other operating systems or newer versions of R, which the default filters drop. The function follows Depends, Imports and LinkingTo, the same fields install.packages() installs by default, and leaves Suggests out. The recursive count is 3.4 times the direct one.
Direct counts rank the wrong packages
To rank every package, I take each package’s full dependency tree once and count how often each name appears in all of them. That count is the package’s reach: how many packages have it somewhere below them.
library(tidyverse)

snapshot <- function(date) {
  available.packages(repos = paste0("https://packagemanager.posit.co/cran/", date),
                     type = "source", filters = "duplicates")
}

ranking <- function(ap) {
  cran <- rownames(ap)
  deps <- \(recursive) tools::package_dependencies(cran, db = ap, recursive = recursive) |>
    map(\(x) intersect(x, cran))                     # drop base R (stats, utils, ...)
  direct <- deps(FALSE)
  tree   <- deps(TRUE)

  tibble(package = cran, footprint = lengths(tree)) |>
    left_join(count(tibble(package = unlist(direct)), package, name = "direct"), by = "package") |>
    left_join(count(tibble(package = unlist(tree)), package, name = "recursive"), by = "package") |>
    mutate(across(c(direct, recursive), \(x) replace_na(x, 0L)),
           share          = recursive / length(cran),
           rank_direct    = min_rank(desc(direct)),
           rank_recursive = min_rank(desc(recursive))) |>
    arrange(rank_recursive)
}
now  <- snapshot("2026-10-01")
then <- snapshot("2017-10-10")   # the oldest snapshot Package Manager keeps

ranks_now  <- ranking(now)
ranks_then <- ranking(then)

ranks_now |>
  select(package, direct, rank_direct, recursive, share) |>
  head(12)
## # A tibble: 12 × 5
##    package   direct rank_direct recursive share
##    <chr>      <int>       <int>     <int> <dbl>
##  1 rlang       3917           3     13513 0.534
##  2 cli         1765          11     13353 0.528
##  3 lifecycle    745          27     12874 0.509
##  4 glue         978          19     12564 0.497
##  5 R6           691          28     12186 0.482
##  6 vctrs        374          54     11949 0.473
##  7 Rcpp        3384           4     11824 0.468
##  8 magrittr    2266           7     11217 0.444
##  9 withr        384          51     11030 0.436
## 10 cpp11        112         146      9840 0.389
## 11 lattice      337          63      9474 0.375
## 12 pkgconfig      8        1039      9007 0.356
vctrs, which most R users never load themselves, is named by 374 packages, 54th by that count, yet 11,949 packages need it, the 6th-largest reach on CRAN. pkgconfig is the extreme case: 8 packages name it, which ranks it 1,039th, but tibble is one of them, and so it sits under 9,007 packages (36% of CRAN). All but one of the 9 packages above 40% are small helpers from the r-lib and tidyverse projects: condition handling (rlang), console messages (cli), deprecation (lifecycle), string templates (glue), classes (R6), vector types (vctrs), the pipe (magrittr) and temporary state (withr). Rcpp, the bridge to C++, is the exception. The ranking also runs the other way: dplyr and ggplot2 have the most direct dependents on CRAN (5,024 and 4,950) but rank 26th and 29th by reach. They are the packages people import, and they carry the helpers underneath.
From a fifth of CRAN to half in nine years
Running the same count on one snapshot a year shows when it happened.
dsp_colors <- c("#0066CC", "#E8862D", "#159A6C", "#7D5BD6",
                "#D64580", "#2AA9B8", "#C9A227")
dsp_theme <- theme_minimal(base_size = 13) +
  theme(plot.background    = element_rect(fill = "#ECECEF", color = NA),
        panel.background   = element_rect(fill = "#ECECEF", color = NA),
        panel.grid.minor   = element_blank(),
        panel.grid.major.x = element_blank(),
        panel.grid.major.y = element_line(color = "grey78"),
        axis.ticks         = element_blank(),
        plot.title         = element_text(face = "bold"),
        strip.text         = element_text(face = "bold"))

watch <- c("rlang", "Rcpp", "vctrs", "MASS")
dates <- c("2017-10-10", paste0(2018:2026, "-10-01"))

trend <- map(dates, function(d) {
  ap  <- snapshot(d)
  rev <- tools::package_dependencies(watch, db = ap, reverse = TRUE, recursive = TRUE)
  tibble(date = as.Date(d), package = watch, share = lengths(rev) / nrow(ap))
}) |>
  list_rbind() |>
  filter(share > 0) |>                               # vctrs reached CRAN in 2019
  mutate(package = factor(package, levels = watch))

labels <- slice_max(trend, date) |>
  mutate(y = share + case_when(package == "vctrs" ~ 0.015,   # vctrs and Rcpp end
                               package == "Rcpp"  ~ -0.015,  # 0.5 points apart
                               .default = 0))

ggplot(trend, aes(date, share, color = package)) +
  geom_line(linewidth = 1.1) +
  geom_point(size = 2) +
  geom_text(data = labels, aes(y = y, label = package),
            hjust = -0.2, fontface = "bold", show.legend = FALSE) +
  annotate("text", x = as.Date("2025-03-01"), y = 0.30, hjust = 1, size = 3.5, color = "grey35",
           label = "ggplot2 4.0.0 drops MASS\n(September 2025)") +
  scale_color_manual(values = dsp_colors, guide = "none") +
  scale_x_date(expand = expansion(mult = c(0.02, 0.1))) +
  scale_y_continuous(labels = scales::percent, limits = c(0, 0.6)) +
  labs(x = NULL, y = "Share of CRAN that needs the package") +
  dsp_theme
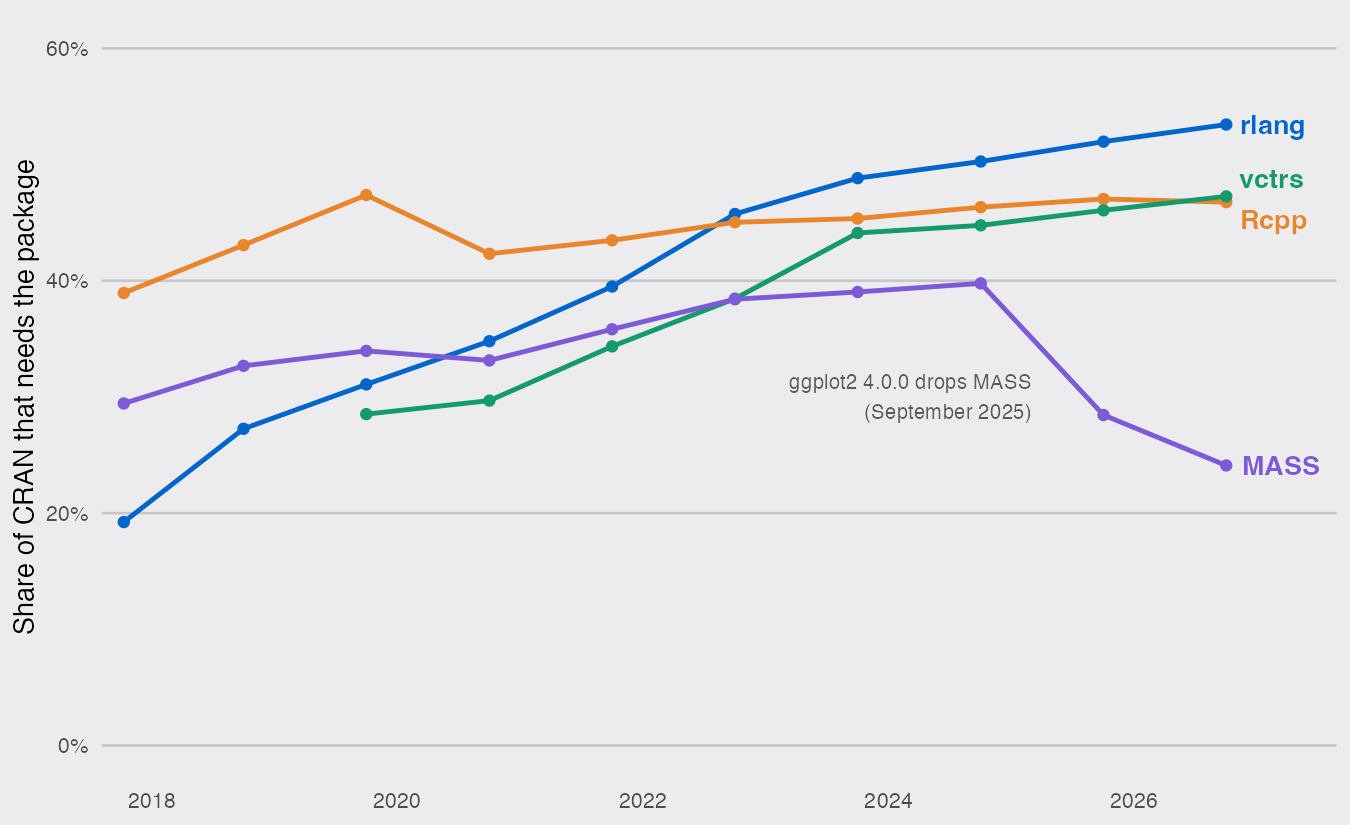
rlang went from 19.2% of CRAN to 53.4% while CRAN itself grew from 11,580 packages to 25,285; Rcpp, the most depended-on package in 2017, moved only from 38.9% to 46.8%. The other side of the same change is what one install pulls in. The median CRAN package needs 15 other CRAN packages to install, up from 4 in October 2017, and the share that needs nothing beyond base R fell from 25.7% to 16.2%.
One ggplot2 release moved thousands of packages
A package’s reach is decided by the packages above it, not by anything in its own code. ggplot2 4.0.0 reached CRAN on 11 September 2025 with a shorter Imports list: MASS, mgcv, glue and tibble were out, and S7, the new object system, was in. The snapshots on either side of that day:
week <- map(c("2025-09-10", "2025-09-12"), function(d) {
  ap  <- snapshot(d)
  rev <- tools::package_dependencies(c("MASS", "mgcv", "glue", "S7"), db = ap,
                                     reverse = TRUE, recursive = TRUE)
  tibble(snapshot = d, cran = nrow(ap), package = names(rev), reach = lengths(rev))
}) |>
  list_rbind()

week |>
  select(package, snapshot, reach) |>
  pivot_wider(names_from = snapshot, values_from = reach) |>
  mutate(change = `2025-09-12` - `2025-09-10`)
## # A tibble: 4 × 4
##   package `2025-09-10` `2025-09-12` change
##   <chr>          <int>        <int>  <int>
## 1 MASS            9132         6450  -2682
## 2 mgcv            6407         1782  -4625
## 3 glue           11333        11353     20
## 4 S7               172         6071   5899
MASS dropped out of 2,682 packages’ dependency trees in two days, 11.8% of CRAN at the time, and mgcv lost 72% of its reach. S7 went from 172 packages to 6,071 overnight. Nothing in MASS or mgcv changed. glue barely moved, because ggplot2 still gets it through scales: a package’s reach only falls when it loses its last path into a dependency tree.
That is the shape of CRAN in 2026. More than half of it rests on a few small packages from one family of projects, much of that weight arrives through hubs like ggplot2, dplyr and tibble, and one maintainer’s decision about Imports can add or remove thousands of packages from someone else’s reach. It holds up because CRAN re-checks a package’s reverse dependencies when a new version is submitted, so an update to rlang has to pass against the packages that use it before it reaches anyone. If you maintain a package, tools::package_dependencies("yourpkg", db = ap, recursive = TRUE) without reverse lists everything your users install along with it.
