In this post, I will show how to scrape google scholar. Particularly, we will use the 'rvest' R package to scrape the google scholar account of my PhD advisor. We will see his coauthors, how many times they have been cited and their affiliations. “rvest, inspired by libraries like beautiful soup, makes it easy to scrape (or harvest) data from html web pages”, wrote Hadley Wickham on RStudio Blog. Since it is designed to work with magrittr, we can express complex operations as elegant pipelines composed of simple and easily understood pieces of code.
Load required libraries:
We will use ggplot2 to create plots.
library(rvest)
library(ggplot2)
How many times have his papers been cited
Let’s use SelectorGadget to find out which css selector matches the “cited by” column.
page <- read_html("https://scholar.google.com/citations?user=sTR9SIQAAAAJ&hl=en&oi=ao")
Specify the css selector in html_nodes() and extract the text with html_text(). Finally, change the string to numeric using as.numeric().
citations <- page %>% html_nodes ("#gsc_a_b .gsc_a_c") %>% html_text()%>%as.numeric()
See the number of citations:
citations
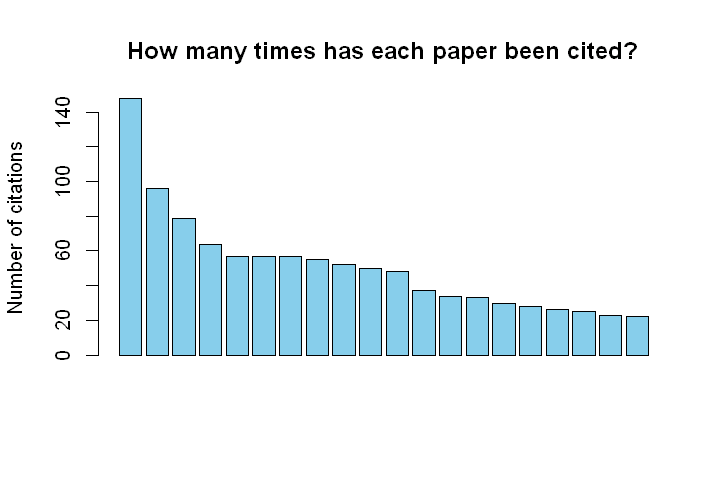
148 96 79 64 57 57 57 55 52 50 48 37 34 33 30 28 26 25 23 22
Create a barplot of the number of citation:
barplot(citations, main="How many times has each paper been cited?", ylab='Number of citations', col="skyblue", xlab="")
Here is the plot:
Coauthors, thier affilations and how many times they have been cited
My PhD advisor, Ben Zaitchik, is a really smart scientist. He not only has the skills to create network and cooperate with other scientists, but also intelligence and patience.
Next, let’s see his coauthors, their affiliations and how many times they have been cited.
Similarly, we will use SelectorGadget to find out which css selector matches the Co-authors.
page <- read_html("https://scholar.google.com/citations?view_op=list_colleagues&hl=en&user=sTR9SIQAAAAJ")
Coauthors = page%>% html_nodes(css=".gsc_1usr_name a") %>% html_text()
Coauthors = as.data.frame(Coauthors)
names(Coauthors)='Coauthors'
Now let’s exploring Coauthors
head(Coauthors)
dim(Coauthors)
                  Coauthors
1               Jason Evans
2             Mutlu Ozdogan
3            Rasmus Houborg
4          M. Tugrul Yilmaz
5 Joseph A. Santanello, Jr.
6              Seth Guikema

[1] 27  1
As of today, he has published with 27 people.
How many times have his coauthors been cited?
page <- read_html("https://scholar.google.com/citations?view_op=list_colleagues&hl=en&user=sTR9SIQAAAAJ")
citations = page%>% html_nodes(css = ".gsc_1usr_cby")%>%html_text()
citations
[1] "Cited by 2231"  "Cited by 1273"  "Cited by 816"   "Cited by 395"   "Cited by 652"   "Cited by 1531"
 [7] "Cited by 674"   "Cited by 467"   "Cited by 7967"  "Cited by 3968"  "Cited by 2603"  "Cited by 3468"
[13] "Cited by 3175"  "Cited by 121"   "Cited by 32"    "Cited by 469"   "Cited by 50"    "Cited by 11"
[19] "Cited by 1187"  "Cited by 1450"  "Cited by 12407" "Cited by 1939"  "Cited by 9"     "Cited by 706"
[25] "Cited by 336"   "Cited by 186"   "Cited by 192"
Let’s extract the numeric characters only using global substitute.
citations = gsub('Cited by','', citations)
citations
[1] " 2231"  " 1273"  " 816"   " 395"   " 652"   " 1531"  " 674"   " 467"   " 7967"  " 3968"  " 2603"  " 3468"  " 3175"
[14] " 121"   " 32"    " 469"   " 50"    " 11"    " 1187"  " 1450"  " 12407" " 1939"  " 9"     " 706"   " 336"   " 186"
[27] " 192"
Change string to numeric and then to data frame to make it easy to use with ggplot2
citations = as.numeric(citations)
citations = as.data.frame(citations)
Affilation of coauthors
page <- read_html("https://scholar.google.com/citations?view_op=list_colleagues&hl=en&user=sTR9SIQAAAAJ")
affilation = page %>% html_nodes(css = ".gsc_1usr_aff")%>%html_text()
affilation = as.data.frame(affilation)
names(affilation)='Affilation'
Now, let’s create a data frame that consists of coauthors, citations and affilations
cauthors=cbind(Coauthors, citations, affilation)

cauthors
                             Coauthors citations                                                                                  Affilation
1                          Jason Evans      2231                                                               University of New South Wales
2                        Mutlu Ozdogan      1273    Assistant Professor of Environmental Science and Forest Ecology, University of Wisconsin
3                       Rasmus Houborg       816                    Research Scientist at King Abdullah University of Science and Technology
4                     M. Tugrul Yilmaz       395 Assistant Professor, Civil Engineering Department, Middle East Technical University, Turkey
5            Joseph A. Santanello, Jr.       652                                                  NASA-GSFC Hydrological Sciences Laboratory
.....
Re-order coauthors based on their citations
Let’s re-order coauthors based on their citations so as to make our plot in a decreasing order.
cauthors$Coauthors <- factor(cauthors$Coauthors, levels = cauthors$Coauthors[order(cauthors$citations, decreasing=F)])

ggplot(cauthors,aes(Coauthors,citations))+geom_bar(stat="identity", fill="#ff8c1a",size=5)+
theme(axis.title.y   = element_blank())+ylab("# of citations")+
theme(plot.title=element_text(size = 18,colour="blue"), axis.text.y = element_text(colour="grey20",size=12))+
              ggtitle('Citations of his coauthors')+coord_flip()
Here is the plot:

He has published with scientists who have been cited more than 12000 times and with students like me who are just toddling.
Summary
In this post, we saw how to scrape Google Scholar. We scraped the account of my advisor and got data on the citations of his papers and his coauthors with thier affilations and how many times they have been cited.
As we have seen in this post, it is easy to scrape an html page using the rvest R package. It is also important to note that SelectorGadget is useful to find out which css selector matches the data of our interest.
Update: My advisor told me that Google Scholar picks up a minority of his co-authors. Some of the scientists who published with him and who my advisor would expect to be the most cited don’t show up. Further, the results for some others are counterintuitive (e.g., seniors who have more publications, have less Google Scholar citations than their juniors). So, Google Scholar data should be used with caution.
If you have any question feel free to post a comment below.


Is there a way to get “cited by” numbers using DOIs? I want to see which articles have the highest citations on a particular topic but the there are thousands of articles in varying disciplines. Any recommendation on how to do this?
Did you make progress on this? I want to do this too.
Nice tutorial! I did however, run into a few roadblocks.
The first is, the way the citations per year are extracted using html_nodes will cause an issue if a paper went a few years without being cited. The returned citations will not say 0, they just won’t be there, creating a mismatch between number of years and number of citation counts. I solved this by doing pattern matching using this command:
gsub(gsub(“as_yhi=”, “”, .)
to find only the years that *did* have citations, but it was a bit of a pain.
The second roadblock is, watch out for how many times you query Google Scholar because it does have a query limit. I tried to extract all of the papers’ data for one author (about 220 papers) and afterward was blocked from accessing that page again (read_html is returning a 503 error). Looking into fixing this with cookies right now but not sure how to do it yet.
Thank you for the share! Do you know how to scrap all the citation number by automatizing the click on “show more” button at the bottom of page?
Hi, thanks for sharing. It worked well for me, but when I tried my friend – and occasional co-author – Leonardo (https://scholar.google.com/citations?user=j1DxzckAAAAJ&hl=en), the routine broken at this step (copied and pasted below). Would you know what’s the problem? Thanks a lot
> cauthors=cbind(Coauthors, citations, affilation)
Error in data.frame(…, check.names = FALSE) :
arguments imply differing number of rows: 5, 0
Thank you!! I will modify it.
Very nice. There are sometimes “*” after the number of citations (this indicates the number includes citations from different versions of the paper), so you need to do
citations <- gsub("[[:punct:]]", "", citations)
before coercing into a numeric vector.
I concur with your adviser, only co-authors who have a Google account AND let their profile be public are picked up.
Thank you!! I will make modifications!
Very nice, congrats.
I had an idea this kind and I found that there are no tutorials on this regard. This tutorial fills a niche that existed quiet few time.
I was wondering, have thought to do also coauthor network analysis ? That would be great if you could possibly to plot also the coauthor network with, lets say, igraph.
All the best.
Thank you! You raised a nice idea. I will give it a try and come up with a blog post sometime.
Nice rvest tutorial. Are you also aware that there’s a package for working with Google Scholar? – https://github.com/jkeirstead/scholar
Thanks for sharing the package.
I installed it and played with it. It is interesting. Thanks for sharing!!
Thanks! Very interesting! I’m using the scholar R package as well, to put my own citations on my personal website: http://rogiersbart.blogspot.be/2015/05/put-google-scholar-citations-on-your.html!
please update your link because it shows 404
Thanks for the notice!