In statistics, an outlier is defined as an observation that stands far away from most of the other observations. Often an outlier is present due to a measurement error. Therefore, one of the most important tasks in data analysis is to identify outliers and, only if necessary, remove them.
There are different methods to detect outliers, including the standard deviation approach and Tukey’s method, which uses the interquartile range (IQR) approach. In this post, I will use Tukey’s method, because I like that it does not depend on the distribution of the data. Moreover, Tukey’s method ignores the mean and standard deviation, which are themselves influenced by the extreme values (outliers).
The Script
I created a script to identify, describe, plot, and remove (if necessary) the outliers. To detect the outliers, I use the command boxplot.stats()$out, which uses Tukey’s method to identify the outliers ranging above and below the 1.5*IQR. To describe the data, I chose to show the number (%) of outliers and the mean of the outliers in the dataset, and I also show the mean of the data with and without the outliers. Regarding the plot, I think the box plot and the histogram are the best for presenting outliers, so the script plots the data with and without the outliers. Finally, with help from Selva, I added a question that asks whether to keep or remove the outliers from the data. If the answer is yes, then the outliers are replaced with NA.
Here is the function; an example follows below:
outlierKD <- function(dt, var) {
  var_name <- eval(substitute(var),eval(dt))
  tot <- sum(!is.na(var_name))
  na1 <- sum(is.na(var_name))
  m1 <- mean(var_name, na.rm = T)
  par(mfrow=c(2, 2), oma=c(0,0,3,0))
  boxplot(var_name, main="With outliers")
  hist(var_name, main="With outliers", xlab=NA, ylab=NA)
  outlier <- boxplot.stats(var_name)$out
  mo <- mean(outlier)
  var_name <- ifelse(var_name %in% outlier, NA, var_name)
  boxplot(var_name, main="Without outliers")
  hist(var_name, main="Without outliers", xlab=NA, ylab=NA)
  title("Outlier Check", outer=TRUE)
  na2 <- sum(is.na(var_name))
  message("Outliers identified: ", na2 - na1, " from ", tot, " observations")
  message("Proportion (%) of outliers: ", (na2 - na1) / tot*100)
  message("Mean of the outliers: ", mo)
  m2 <- mean(var_name, na.rm = T)
  message("Mean without removing outliers: ", m1)
  message("Mean if we remove outliers: ", m2)
  response <- readline(prompt="Do you want to remove outliers and to replace with NA? [yes/no]: ")
  if(response == "y" | response == "yes"){
    dt[as.character(substitute(var))] <- invisible(var_name)
    assign(as.character(as.list(match.call())$dt), dt, envir = .GlobalEnv)
    message("Outliers successfully removed", "\n")
    return(invisible(dt))
  } else{
    message("Nothing changed", "\n")
    return(invisible(var_name))
  }
}
To call the function, run the code below (make sure you replace dat with your dataset name, and variable with your variable name):
source("https://goo.gl/4mthoF")
outlierKD(dat, variable)
Here is an example with the mtcars dataset:
source("https://goo.gl/4mthoF")
outlierKD(mtcars, hp)
yes
Outliers identified: 1 from 32 observations
Proportion (%) of outliers: 3.125
Mean of the outliers: 335
Mean without removing outliers: 146.6875
Mean if we remove outliers: 140.612903225806
Do you want to remove outliers and to replace with NA? [yes/no]: yes
Outliers successfully removed
The function identified one outlier out of 32 observations (about 3%), and shows how the mean changes when the outlier is removed. Here is an example of the plot:
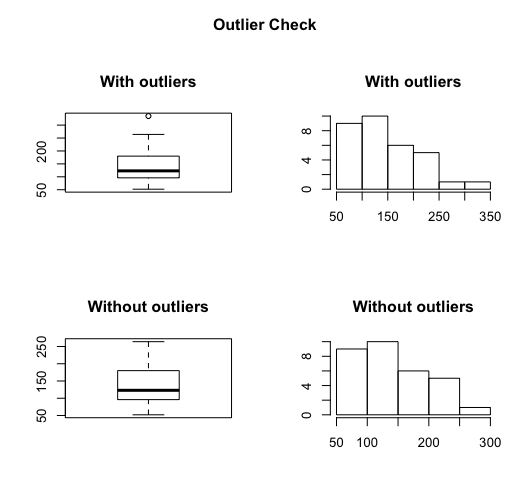
Finally, I strongly suggest thinking carefully before you decide to remove an outlier from your data. An outlier is not necessarily a value that stands far from the mean, but rather a value that was wrongly added to your data.
If you have questions, please leave a comment below.


I just want to express my gratitude for this valuable information. It helps a lot with my research/project. Thank you.
How do I get a list of all the outlier values and where they are in the data set?
as.character(as.list(match.call())$dt)
this line is special for me
Thanks! that was helpful. That being said, how to detect those exact records that are outliers using one line of command?
Is there a python version of this script?
Nice script, but how can i label the outlier in boxplot in R. that which one is outlier from the dataset.
Hi Klodian ! Thank’s for this.
I don’t understand this code line :
var_name <- eval(substitute(var),eval(dt)) Can you explain to me the function eval and subsitute ?
Nice script. I have a DF with 20 columns. I want to see(rather list of columns) which columns are having outliers. can we have script for this?
You need to create a loop, but it is impossible in the current form of the function.
Thanks a lot for your reply.
@datascienceplus:disqus , Thanks for such useful code! I tried to remove the outlier and i got the following error message:
Error in dt[as.character(substitute(TT_FF))] <- invisible(var_name) :
object of type 'closure' is not subsettable
Looks like an awesome script. However, I am getting this error:
Error in eval(substitute(var), eval(dt)) : numeric ‘envir’ arg not of length one
Any ideas?
I think should be an issue with your data set. I just tested the script and works well.
source(“https://goo.gl/4mthoF”)
outlierKD(iris, Sepal.Width)
Does this code boxplot.stats(DATA$VARIABLE)$out works for you?
with some objects of my dataframe its working and for some not
i have this error message :
Error in eval(substitute(var), eval(dt)) :
numeric ‘envir’ arg not of length one
what is the problem ?
thanks
Same for me. Just posted the same question. (Did not see this one before.)
Klodian, this is an AMAZING script, is there a way to have it NOT ask for the outlier removal, instead just remove them?
it is possible, you need to customize the script.
Dear Klodian, I was able to do it! Let me ask you another question, How can I run this script by group? I have 95K obs divided into 1050 groups, is there a way to check the outliers by group? Thanks in advance
I think I got this question in earlier comments. I think you can create a loop to call variables one by one and to check for outliers.
Hey Edgar! Do you have an update on how you did this? Thanks!
Can you run with categorical variables to match? I have a column of vegetation heights (continuous) per meter increments (categorical) up to 30 meters. Approximately 40 values per meter increment. Can I amend the code to find the outlier per each increment?
Although it is possible to have outliers in categorical data, I did not tested the code with categorical variables. You may give a try. The code code of the script is outlier <- boxplot.stats(VARIABLE)$out
This is absolutely wonderful work,
Is there a way we can do this for an entire matrix/dataframe?
here var=1column but I would like to do this for all columns.
Thank you so much!
I replace all instances of ”dt’ and ‘var’ with my dataframe and variable I want to treat, everything runs without error, but I am not prompted to delete the outliers that were identified. My variable is a numeric count of team wins for a baseball team. Any ideas why?
outlierKD <- function(mb.df, TARGET_WINS) {
+ var_name <- eval(substitute(TARGET_WINS),eval(mb.df))
+ tot <- sum(!is.na(var_name))
+ na1 <- sum(is.na(var_name))
+ m1 <- mean(var_name, na.rm = T)
+ par(mfrow=c(2, 2), oma=c(0,0,3,0))
+ boxplot(var_name, main="With outliers")
+ hist(var_name, main="With outliers", xlab=NA, ylab=NA)
+ outlier <- boxplot.stats(var_name)$out
+ mo <- mean(outlier)
+ var_name <- ifelse(var_name %in% outlier, NA, var_name)
+ boxplot(var_name, main="Without outliers")
+ hist(var_name, main="Without outliers", xlab=NA, ylab=NA)
+ title("Outlier Check", outer=TRUE)
+ na2 <- sum(is.na(var_name))
+ message("Outliers identified: ", na2 – na1, " from ", tot, " observations")
+ message("Proportion (%) of outliers: ", (na2 – na1) / tot*100)
+ message("Mean of the outliers: ", mo)
+ m2 <- mean(var_name, na.rm = T)
+ message("Mean without removing outliers: ", m1)
+ message("Mean if we remove outliers: ", m2)
+ response <- readline(prompt="Do you want to remove outliers and to replace with NA? [yes/no]: ")
+ if(response == "y" | response == "yes"){
+ mb.df[as.character(substitute(TARGET_WINS))] <- invisible(var_name)
+ assign(as.character(as.list(match.call())$mb.df), mb.df, envir = .GlobalEnv)
+ message("Outliers successfully removed", "n")
+ return(invisible(mb.df))
+ } else{
+ message("Nothing changed", "n")
+ return(invisible(var_name))
+ }
+ }
It is not necessary to edit the main code. You only need to run this code:
source(“https://goo.gl/4mthoF”)
outlierKD(dat, variable)
there, replace “dat” with the name of your dataset, and “variable” with the variable you want to check for outliers.
I did that. Still no output or error messages
https://uploads.disquscdn.com/images/4197ff90e666eee741e07aa44dba782eeb3d58fd6ba654d78ed1e96dc60d62e5.png
forget about the script. Focus on this line of codes:
source(“https://goo.gl/4mthoF”)
outlierKD(YOURDATA, YOURVARIABLE)
I don’t know how else to phrase my question. You told me to replace dt and val: that’s what I did. I highlighted that in the screenshot in my previous post. After listening to your advice, there is still no output. This is most likely error on my part, but I appear to be using your code as you suggest.
Step 1.
source(“https://goo.gl/4mthoF”)
Step 2.
outlierKD(YOURDATA, YOURVARIABLE)
if this doesn’t work, than probably something is wrong with your data or script.
I encountered something similar. Try referencing your column in your data frame a different way, which worked for me.
try:
outlierKD(mb.df, mb.df$TARGET_WINS)
type in the name of your dataframe followed by the $ symbol, which should bring up a list of all the factors/columns in your DF.
The input contracts should have been more clearly stated. The problem I encountered is not a direct result of that, but it was not immediately clear the type of data the function expected as input. I always comment the mode/class of the expected input for each variable above the function declaration for this purpose. Even more important if you are sharing your code online and expecting others to use it.
Hello! Trying to install this package, which I have used successfully on other computers in the past, says it is not available for R 3.4.1
Is there plans to support it or am I doing something wrong? I am running 64 bit R.
I absolutely love the program, I want to keep using it! Thank you for being awesome!
Hi Jack,
Which package are referring?
You need to run this code:
source(“https://goo.gl/4mthoF”)
outlierKD(dat, variable)
I apologize for that question. I had forgotten when I ran it I didn’t use a package, I just copy pasted that code.
That was pretty dumb of me, but seriously an amazing script. I really appreciate it!
Dear Klodian,
When i try to remove outliers it shows error like this,
Do you want to remove outliers and to replace with NA? [yes/no]: yes
Error in `[.data.table`(x, i, which = TRUE) :
When i is a data.table (or character vector), the columns to join by must be specified either using ‘on=’ argument (see ?data.table) or by keying x (i.e. sorted, and, marked as sorted, see ?setkey). Keyed joins might have further speed benefits on very large data due to x being sorted in RAM.
Is there any problem with data class? Any help is appreciated.
Thanks, D
your dataset might be an issue.
You might need to convert your dataset from a list to a dataframe.
Example
modified_dataset = as.data.frame(current_dataset)
outlierKD(modified_dataset, variable)
I am getting this error – Error in plot.new() : figure margins too large. my column have only 21000 Values , still it is giving an error
Hi. Try this “par(mar = rep(2,4)”
split the data before you run the function.
dt1 = subset(data, age>55)
Thank you for this. I am having a similar issue to what Karen stated below. I have a dataframe, the variable is continuous, but when I run the code it identifies the outliers, but does not remove them. Any help would be appreciated.
Solved it, I was expected something else. The ways you have it is perfect!
Thank you for taking it, Klodian…
Again, congrats to you!
Sorry for being picky… There’s a “r” missing in “Proportion” from the output… 🙂
Cheers,
Bruno
Script is updated. Let me know if you find any issue!
Hi Klodian,
Sorry for messing your function up… However, Shapiro-Wilk Normality test will only run if sample size is between 3 and 5,000. In fairness, now I reckon my suggestion is not feasible whatsoever. I have tried with a sample size > 5,000 and shapiro.test() returns an error message. Once again, sorry to mess it up.
Dont worry Bruno! I have updated the script again.
Hello Klodian,
What a great piece of work! These routines on R are often time consuming for those who are not quite familiar with coding functions in R. If you are still working on this and is keen to get another feedback, what if any normality testing be included in the output? Such as a Shapiro-Wilk p-value before and after the outliers removal.
Anyway, if that was not on your plan for some reason, the function by itself is already great!
Hi Bruno, this is a good idea. Although I am using Tukey’s method which is not dependent on distribution of data, it is interesting to know how normality of data change. If I am able to add Shapiro-Wilk p-value into the script I will post a comment here.
Hi Klodian, Thank you so much for this. How would you like us to cite the use of your code? Thank you, Emma
Thanks Emma! You can refer to this webpage if is necessary.
Hello! Thank you very much for the script!
How can I know which are the outliers identified?
I would like to get a report showing which are these outliers.
Hi,
I don’t know if I am just stupid or what but If I say yes to remove outliers, it is not removed in the data set and replaced with NA. If I tried to assign it as an object:
data.outliersremoved <- outlierKD (data, variable)
it also doesn't work. But when I ran the test, it can see 8% outliers even after pressing yes.
Thanks.
Hi Karen,
I assume that your variable is continuous, and you are loading the script first source(“http://goo.gl/UUyEzD”), and replacing dat with dataname, and variable with variable name.
Once you press yes, the outliers will be removed from data. if you check again it might show other outliers, you have to decide which one is outlier and which one is not.
this code data.outliersremoved <- outlierKD (data, variable) should not work.
Hi,
Thanks for your reply. Since I did it on sample data (36 samples), I can manually check as well if the NA was put and the values are still there. I also ran just the usual
outlierKD (data, variable)
repeatedly it doesn’t work. I normally manually check outliers using
boxplot.stats(data$variable)$out
to also counter-check with your code and its still showing the outliers. So I also tweaked your code a bit but this also did not work so that is why I asked you. It really seems simple though so I don’t know what could be wrong.
I attached here a grabscreen.
https://uploads.disquscdn.com/images/83a33a8592d2c1324e38fd19e23a0b80c3f9a54a8eed6f0fd1c6b82f70664ca8.jpg
is your variable numeric? is.numeric()
Yup. Should it not be numeric?
Should be numeric. I will re-test the code within a week and post a comment here.
Everything is okay now when I converted the data into a data.frame format (see above comment). maybe you could include explicitly in the code that it doesn’t work with data.table formats.. (though you can also test this to be sure) 🙂
Hello Klodian!!
Thanks a lot for the script!!
I have a question… I got 19.1% outliers but in the field “Mean if we remove outliers” I got 0, how come?? What about the mean of the other ~80% ????
Thanks a lot again!!!
Trini
Hi Trini,
19.1% is a large amount of outliers which I will think twice before I decide to remove. Check the distribution of your data.
Hello Klodian,
Thank you for this post strongly usefull.
Bye.
I’m using an instrument with poor “accuracy”. Is it inappropriate to filter the collected data using the outlier concept? http://stats.stackexchange.com/questions/208504/biological-sample-size-when-instrument-accuracy-is-weak
I think that the poor “accuracy” is associated with higher odds of measurements errors and this will lead to present of outliers in your data.