Sentiment analysis is a method of analyzing a piece of text and deciding whether the writing is positive, negative or neutral. It is commonly used to understand how people feel about a topic.
E.g – What people think about Trump winning the next election or Usain Bolt finishing the race in 7 seconds. These days the information is hugely recorded on social media platforms and a lot of predictions like who will win the election or a match is being done through that recorded information.
Last year Brexit was a very intense topic for all the people around the world not just in UK or EU. Social media was used by people and politicians to prove their points and resultant there were comments, tweets, and posts in support and against of Brexit. Following this example, here we are going to get familiar with tweepy (Library for Twitter analysis) and Aylien (library with auto sentiment classification) by determining the sentiments of Brexit tweets as positive, negative and neutral.
Getting started
To start with Sentiment Analysis using twitter, we would need to get the details which are required for Tweepy and Aylien in order to work. Below are the steps which should be followed –
-
1) Setup a twitter account on – https://twitter.com/
2) Go to twitter application account – https://apps.twitter.com/
3) Create a new app and fill out required details.
4) Once you are finished, the created application will be displayed on application management page.
5) Click on the application and go to the tab “Keys and Access token”.(these details will be used later in this post)
Once you are done with twitter setup. We can move on to Aylien –
-
6) Go to Aylien website – https://aylien.com/
7) Select Sign up for Text Analysis API as we will doing text analysis in this exercise.
8) You will receive an email with an activation link, once clicked you are good to go and will have application id and key.
So, we have got all the details which will be used for Tweepy and Aylien.
Creating corpus
We want to analyze the Brexit data from twitter but we don’t have any data to analyze. So, here we are going to create a corpus or collection of tweets which include Brexit talk.
The below piece of code uses api.search() method to search the Twitter database to find any given query term, here we have given #brexit. Setting up the count to 100 decreases the chances of search query failure.
#search query and store your results in a variable(JSON format)
search_results = api.search(q = "#brexit", lang = "en", result_type = "recent", count = 100)
The results retrieved from the above step will be used to create the a text file. We have used the codec to avoid formatting issues when the program reads the JSON search_results and writes utf-8 text.
file = codecs.open("brexit.txt", "w", "utf-8")
for result in search_results:
    file.write(result.text)
    file.write("\n")
file.close()
The brexit.text file is our corpus and we will use to analyze sentiments.
Sentiment Analysis
Now that we have a corpus, we need to determine which tweet is positive, negative or neutral. There are many ways to categorize them, e.g – a few people prefer writing their own code by creating two dictionaries consisting of bad and good words. We are not going write lots of code but are going to use
Aylien, which has inbuilt functions to determine the tweet sentiments.
The code below will read the text file line by line and will apply sentiment function. Once the data will be passed through sentiment function, we can create a CSV file which will have two columns – one for tweet text and another for sentiment type(polarity).
# Initialize a new client of AYLIEN Text API
client = textapi.Client("", "")

with io.open('brexit_tweet_SA.csv', 'w', encoding='utf8', newline='') as csvfile:
    csv_writer = csv.writer(csvfile)
    csv_writer.writerow(["Tweet", "Sentiment"])
    with io.open("brexit.txt", 'r', encoding='utf8') as f:
        for brex_tweet in f.readlines():
            ## Remove extra spaces or newlines around the text
            tweet = brex_tweet.strip()
            ## Reject tweets which are empty so you don’t waste your API credits
            if len(tweet) == 0:
                #print('skipped')
                continue
            ## Make call to AYLIEN Text API
            sentiment = client.Sentiment({'text': tweet})

            ## Write the sentiment result into csv file
            csv_writer.writerow([sentiment['text'], sentiment['polarity']])
Now that we have a file with details about tweets and their’s sentiments, we should try and visualize the data.
Visualize the data
Visualizing your results is the core part of the analysis, showing sentiment analysis in a simple pie chart will give a clear picture of sentiments(thoughts) of people without even looking at the data. We will be using Pandas and Matplotlib to create the chart.
#open up your csv file with the sentiment results
with open('brexit_tweet_SA.csv', 'r', encoding = 'utf8') as brexcsvfile:
        # Pandas to read the “Sentiment” column,
        df_brex = pd.read_csv(brexcsvfile)
        sent_tweet = df_brex["Sentiment"]

#use Counter to count how many times each sentiment appears and save each as a variable
        counter_var = Counter(sent_tweet)
        positive = counter['positive']
        negative = counter['negative']
        neutral = counter['neutral']

## declare the variables for the pie chart, using the Counter variables for “sizes”
labels = 'Positive', 'Negative', 'Neutral'
sizes = [positive, negative, neutral]
colors = ['blue', 'yellow', 'black']
text = "brexit"

## use matplotlib to plot the chart
plt.pie(sizes, labels = labels, colors = colors, shadow = True, startangle = 90)
plt.title("Sentiment of 100 Tweets about "+ text)
plt.show()
The above code will return pie chart as below:
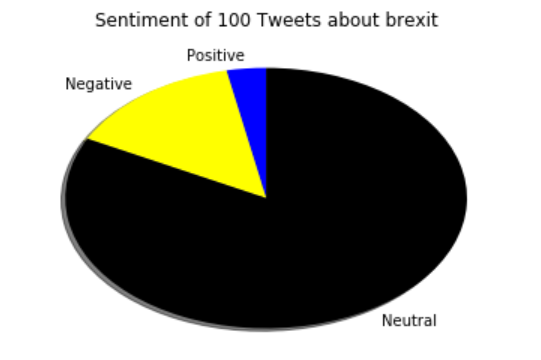
You can see from the above chart that a lot of people don’t have any strong opinion on Brexit but there is less number of people who said a negative thing about Brexit.
Summary
The sentiment analysis became easier by using Tweepy and AYLIEN, imagine doing this analysis manually. While doing this exercise I noticed few things, e.g, the tweets which were not actually against of Brexit but sounded negative were categorized as negative. so, we will need to do some preprocessing of data. This exercise was meant to get people familiar with Tweepy and AYLIEN, the code for the exercise can be found on my Github. To complete this exercise, I have taken reference from aylien website blog page and twitter developer site.