Unlike Google PlayStore Developer Console for Android App, iOS App Store’s iTunes Connect does not help developers with the bulk download of App Store iTunes Reviews. So if you are an iOS App Developer or a Mobile App Product Manager, You are left with no option but to get paid subscription like App Annie to access and analyze iOS App Store iTunes Reviews of your App.
itunesr an R package to access and analyse iOS App Store iTunes Reviews and We will see how to use itunesr to analyse iTunes Reviews of any iOS App for free.
Installation & Loading:
itunesr can be directly installed from CRAN or the development version from Github.
# install itunesr directly from CRAN:
install.packages("itunesr")

#  the development version from GitHub:
# install.packages("devtools")
devtools::install_github("amrrs/itunesr")

library(itunesr)
Reviews Extraction:
To access reviews of any iOS App, We need to have the App Id. The App ID of an iOS App ID could be found in its iTunes URL (Link). Below is the screenshot showing how to identify the App ID of Uber iOS App.

Now we have got the App ID – 368677368 for which we are going to access iTunes Reviews and analyse it.
We can extract iTunes Reviews of any app with `getReviews()` function which takes 3 arguments – 1. App ID, 2. Country Code, 3. Recency / Reviews Page Data . Let us extract the reviews of Uber iOS App.
#Latest (Page 1) Uber Reviews for the Country: US
uber_reviews <- getReviews(368677368,'us',1)
As mentioned above, getReviews extracts most recent 50 reviews ~ 1st page from US App Store for Uber App and stores the information in uber_reviews as a dataframe.
Following are the attributes of Reviews that are extracted using getReviews:
#Displaying the column names
names(uber_reviews)
[1] "Title"       "Author_URL"  "Author_Name" "App_Version" "Rating"      "Review"      "Date"
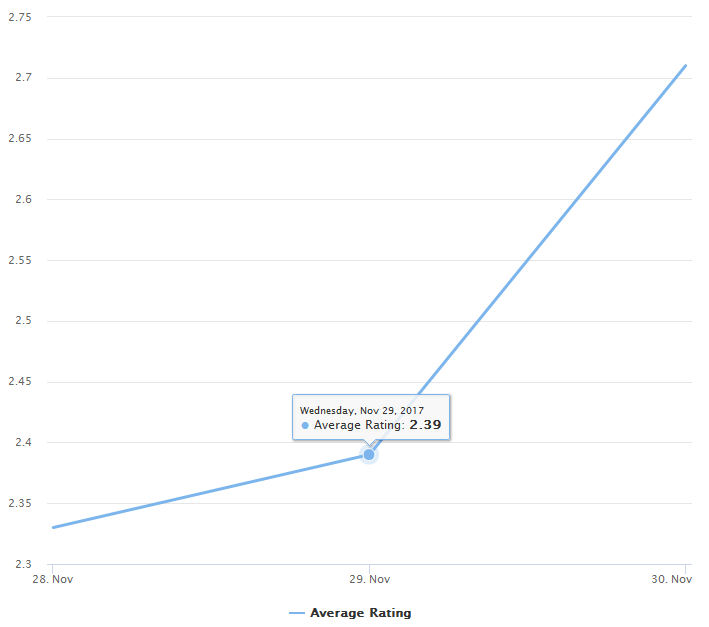
Ratings Trend:
Let us trend the Average Ratings for the Reviews received for each day. We will use highcharter package for an interactive plot of this Average Rating Trend.
#Ratings Trend
library(highcharter)
library(dplyr)
library(lubridate)
dt <- uber_reviews
dt$Date <- as.Date(dt$Date)
dt$Rating <- as.numeric(dt$Rating)
dt <- dt %>% select(Date,Rating) %>% group_by(Date) %>% summarise(Rating = round(mean(Rating),2))
highchart() %>%   hc_add_series_times_values(dt$Date,dt$Rating, name = 'Average Rating')
Gives this interactive plot:
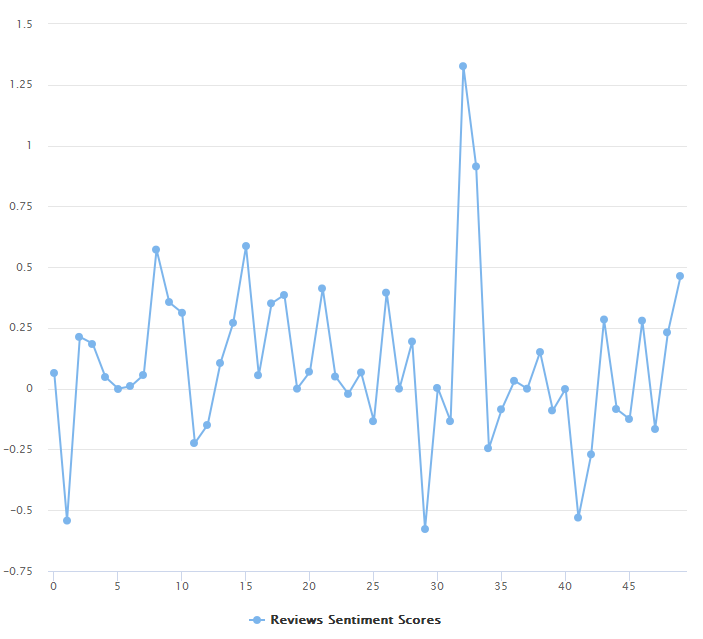
Sentiment Analysis of Reviews:
Having trended Average Rating over Days, Let us implement the most obvious Text Analytics implementation – Sentiment Analysis.
#Sentiment Analysis
library(sentimentr)
reviews_only <- as.character(uber_reviews$Review)
sentiment_scores <- reviews_only %>% sentiment_by(by=NULL)
highchart() %>% hc_xAxis(sentiment_scores$element_id) %>% hc_add_series(sentiment_scores$ave_sentiment, name = 'Reviews Sentiment Scores')
Gives this plot:
With that, We have accessed iTunes Reviews of Uber iOS App, performed a basic exploratory analysis and sentiment analysis of the reviews verbatim. This is more than what the paid version of App Annie or similar tool can offer, but can be done for free with R using itunesr package. The code and plots used in this post are available on my github.
References:
Hi, This is great thanks,
is it possible to pull more than one page at a time of reviews?
Hello,
This is something which is extremely useful to me thanks a lot for publishing this.
One question, where did you get the dt$date from? the getReviews function does not fetch any Date values
Thanks Mitt. The issue was the package was recently updated to fix a bug that Apple was causing for a few days. Fortunately, that Apple bug was resolved and the development version of the package was fixed.
In short, install package from github using devtools::install_github(‘amrrs/itunesr’) fixes it.