Cryptocurrency market has been growing rapidly that being an Analyst, It intrigued me what does it comprise of. In this post, I’ll explain how can we analyse the Cryptocurrency Market in R with the help of the package coinmarketcapr. Coinmarketcapr package is an R wrapper around coinmarketcap API.
To get started, Let us load the library into our R session and Plot the top 5 Cryptocurrencies.
library(coinmarketcapr)
plot_top_5_currencies()
Gives this plot:
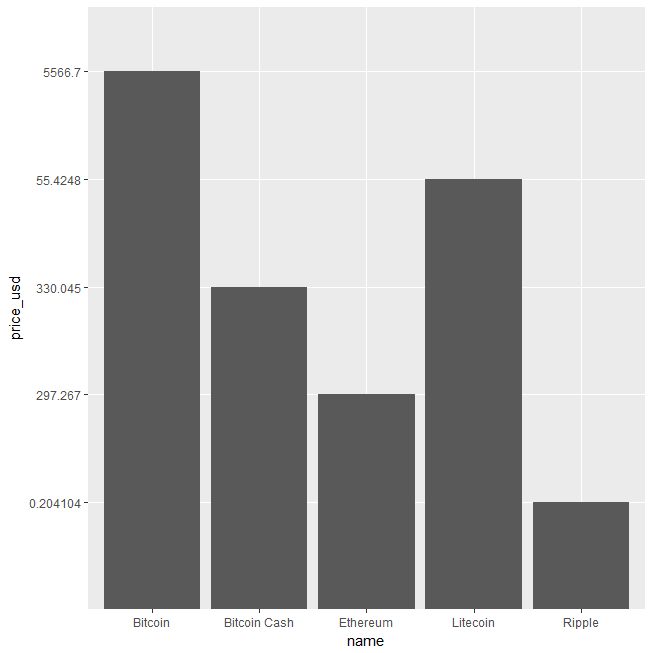
The above plot clearly shows how bitcoin is leading the market but that does not give us the picture of how the marketshare is split among various cryptocurrencies, so let us get the complete data of various cryptocurrencies.
market_today <- get_marketcap_ticker_all()
head(market_today[,1:8])
              id         name symbol rank price_usd  price_btc X24h_volume_usd market_cap_usd
1      bitcoin      Bitcoin    BTC    1   5568.99        1.0    2040540000.0  92700221345.0
2     ethereum     Ethereum    ETH    2   297.408  0.0537022     372802000.0  28347433482.0
3       ripple       Ripple    XRP    3  0.204698 0.00003696     100183000.0   7887328954.0
4 bitcoin-cash Bitcoin Cash    BCH    4   329.862  0.0595624     156369000.0   5512868154.0
5     litecoin     Litecoin    LTC    5    55.431   0.010009     124636000.0   2967255097.0
6         dash         Dash   DASH    6   287.488  0.0519109      46342600.0   2197137527.0
Having extracted the complete data of various cryptocurrencies, let us try to visualize the marketshare split with a treemap. For plotting, let us extract only the two columns ID and market_cap_usd and convert the market_cap_usd into numeric type and a little bit of number formatting for the treemap labels.
library(treemap)
df1 <- na.omit(market_today[,c('id','market_cap_usd')])
df1$market_cap_usd <- as.numeric(df1$market_cap_usd)
df1$formatted_market_cap <-  paste0(df1$id,'\n','$',format(df1$market_cap_usd,big.mark = ',',scientific = F, trim = T))
treemap(df1, index = 'formatted_market_cap', vSize = 'market_cap_usd', title = 'Cryptocurrency Market Cap', fontsize.labels=c(12, 8), palette='RdYlGn')
Gives this plot:
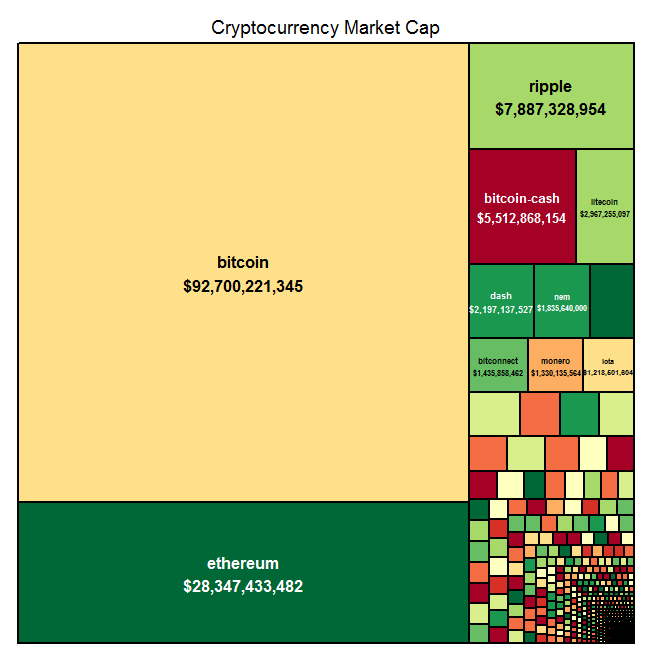
The above visualization explains the whole cryptocurrency market is propped by two currencies primarily – Bitcoin and Etherum and even the second ranked Etherum is far behind than Bitcoin which is the driving factor of this market. But it is also fascinating (and shocking at the same time) that both Bitcoin and Etherum together create a 100 Billion Dollar (USD) market. Whether this is a sign of bubble or no – We’ll leave that for market analysts to speculate, but being a data scientist or analyst, We have a lot of insights to extract from the above data and it should be interesting analysing such an expensive market.
If you are interested in building an R Shiny application to track Daily Bitcoin price check here and also you can learn more from Datacamp’s Building Web Applications in R with Shiny Course.
Warning in install.packages :
package ‘coinmarketcapr’ is not available (for R version 3.6.1)
Could you please let me know how to solve this issue?
I was wondering how to get the data for the next 100, and the next after that and so on… perhaps its there in your next articles, I am yet to read them.
Nice article. Good to know the coinmarketcapr package.
Thanks @shanmdphd:disqus Feel free to share your works with that package!