
A model’s token price does not tell you what an AI agent costs to finish a task. One run may stop after the first call; another may make several attempts before it succeeds. A useful estimate needs both the cost of an attempt and the chance that the task finishes before the retry limit.
This tutorial builds a small Python calculator and chart for that question. It evaluates 36 combinations of per-attempt cost, failure probability and retry cap, then adds a mixed-workload example to show why one average failure rate can hide expensive tasks. The values are constructed assumptions, not provider benchmarks or production measurements. No live API calls or customer data are used.
Define the unit before multiplying by volume
I use cost per completed task to mean total spend on all attempts divided by the number of tasks that finish successfully. Report the completion rate separately: successful tasks divided by tasks started. A task that exhausts its retries stays in the started-task count, but not in the completed-task count. Failed attempts still add to spend.
Providers commonly price input and output tokens separately, and tool or infrastructure charges may be separate again. Treat those as inputs to the calculator: measure the cost of one representative attempt from your own workload, or calculate it from current provider rates. OpenAI’s API documentation, for example, distinguishes input, cached-input and output token rates; it also documents separate charges for some built-in tools. Check the current rate card before using any estimate. (Pricing, usage and cost fields)
For the first model, every attempt has the same cost, c, and the same independent probability of failure, q. The agent gets one initial attempt plus at most R retries. A success ends the task; failures continue until the retry cap is reached.
Build the expected-cost calculator
The model is analytical rather than a random simulation. With a failure probability q, the chance of reaching attempt two is q, attempt three is q², and so on. That gives an expected attempt count of 1 + q + q² + … + qᴿ. The chance the task completes is 1 - q^(R+1).
from itertools import product

attempt_costs = [0.02, 0.05, 0.10]  # illustrative dollars per attempt
failure_rates = [0.05, 0.20, 0.40]
retry_caps = [0, 1, 2, 3]           # retries after the first attempt

def evaluate(cost, q, retries, tasks=10_000):
    expected_attempts = sum(q ** k for k in range(retries + 1))
    completion_rate = 1 - q ** (retries + 1)
    spend_per_task = cost * expected_attempts
    cost_per_success = spend_per_task / completion_rate
    return {
        "expected_attempts": expected_attempts,
        "completion_rate": completion_rate,
        "expected_spend": spend_per_task * tasks,
        "expected_successes": completion_rate * tasks,
        "cost_per_success": cost_per_success,
    }

rows = [
    {"attempt_cost": cost, "failure_rate": q, "retry_cap": retries,
     **evaluate(cost, q, retries)}
    for cost, q, retries in product(attempt_costs, failure_rates, retry_caps)
]
print(f"Scenarios: {len(rows)}")
for row in rows:
    if row["attempt_cost"] == 0.05:
        print(row)
The 3 × 3 × 4 grid produces 36 scenarios. Changing the three lists lets you enter different measured attempt costs, failure rates or retry caps. The expected totals can be fractional because they describe averages over many tasks, not a claim that a fraction of one task completed.
The result that makes retry budgets easier to read
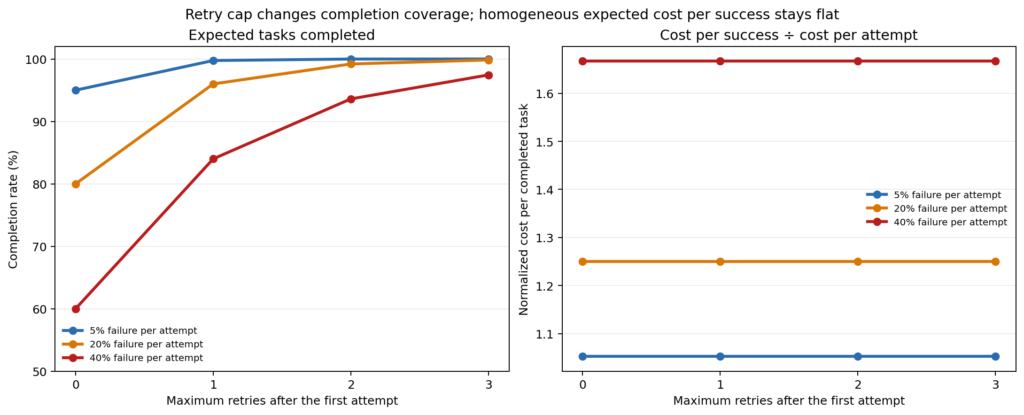
In this homogeneous model, raising the retry cap increases the completion rate and total spend. Yet expected cost per completed task stays constant for a given q and c.
| Failure chance on each attempt | Retry cap | Completion rate | Spend per 10,000 tasks at $0.05/attempt | Cost per completed task |
|---|---|---|---|---|
| 20% | 0 | 80.00% | $500 | $0.0625 |
| 20% | 1 | 96.00% | $600 | $0.0625 |
| 20% | 2 | 99.20% | $620 | $0.0625 |
| 20% | 3 | 99.84% | $624 | $0.0625 |
The equation explains the flat line. Expected spend per task is c × (1 - q^(R+1)) / (1 - q). Divide that by completion probability, 1 - q^(R+1), and the retry-cap term cancels. The result is c / (1 - q).
That does not mean retries are free. The 20% example spends $124 more per 10,000 tasks at a cap of three than at a cap of zero, while completing 1,984 additional tasks. The flat cost-per-completion ratio says the extra completions arrive at the same expected unit cost under these assumptions. It does not say whether those completions are valuable enough, fast enough, or correct enough.
Why one average failure rate can mislead
Real workloads contain different tasks. Easy tasks may be cheap and reliable; difficult tasks may cost more and fail more often. Adding retries can then change which tasks finish, so the average cost per completed task can move.
Here is a constructed mix: 50% easy tasks at $0.02 per attempt with a 5% failure chance; 35% medium tasks at $0.05 and 20%; and 15% hard tasks at $0.12 and 50%. The model keeps failures independent within each class and uses the same retry cap for all classes.
| Maximum retries | Completed out of 10,000 | Expected spend | Cost per completed task |
|---|---|---|---|
| 0 | 8,300 | $455.00 | $0.0548 |
| 1 | 9,472.5 | $585.00 | $0.0618 |
| 2 | 9,783.9 | $637.25 | $0.0651 |
| 3 | 9,900.6 | $661.16 | $0.0668 |
The higher cap recovers more hard tasks, but those tasks consume more attempts and cost more. Completion improves from 83.0% to 99.0%; cost per completed task also rises by about 22%. That is not a verdict against retries. It is a reminder to compare the extra completed work with its business value and human-review burden.
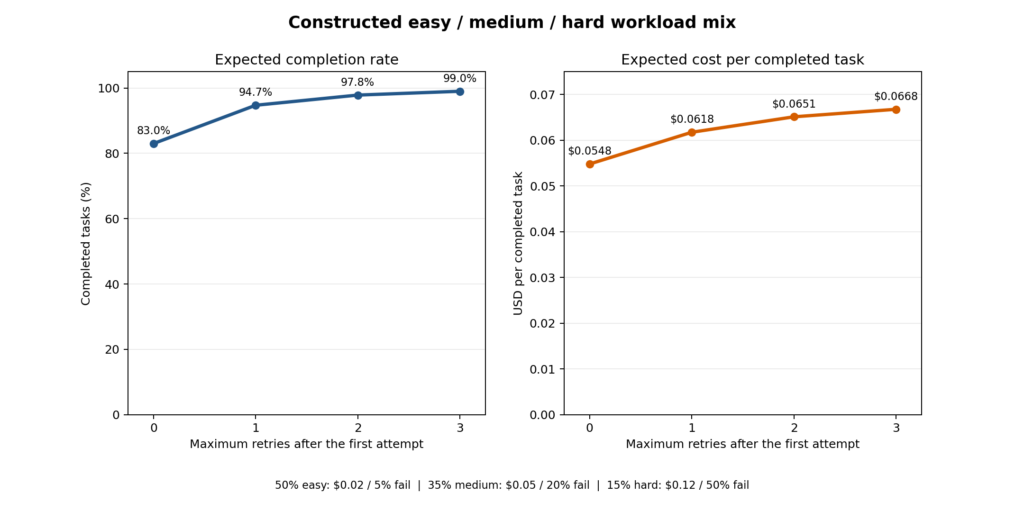
Figure 2. Analytical expected values from the stated constructed cohort shares, attempt costs, and independent failure rates; not measured workload data.
Replace assumptions with a small cost ledger
Before using the model for budgeting, record one row per attempt. A practical ledger needs a stable task ID, attempt number, model, input and output tokens, cached tokens if billed separately, direct tool charges, infrastructure cost if material, outcome, and whether a human accepted the result. Count failed attempts too; otherwise the denominator hides part of the bill.
Then group by task type instead of relying on one global average. For each group, calculate cost per attempt, failure rate, completion rate at each retry cap, cost per completed task, and review time. If later attempts include more context, use a different cost for each attempt. If failures cluster during outages or rate limits, the independent-failure assumption is wrong; estimate from observed sequences or model those windows separately.
Limits and a decision rule
This calculator assumes a task is either complete or not, attempts cost the same within a class, and each failure probability stays constant between retries. It does not model latency, backoff, correlated failures, idempotency risk, refunds, cached-token discounts, tool-specific fees, quality differences, or human correction time. A retry that repeats a non-idempotent action may create a much larger cost than the model shows.
Use the calculator to choose what to measure, not to forecast a production bill from guessed values. Start with the retry budget that meets your completion target, then compare the extra spend and review load against the value of the recovered tasks. Report completion rate and cost per completed task together; either metric alone can hide an important trade-off.
Disclosure: AI tools assisted with research, code preparation, drafting and the charts. The scenario values are constructed and are not live product or customer measurements. Daniel Martin is co-founder of AgentSEO; this article is educational, contains no AgentSEO product claim or promotional link, and does not use AgentSEO customer data.

