This is a continuation of my previous article, where I gave a basic overview of how to construct heatmaps in R. Here, I will show you how to use R packages to build a heatmap on top of the map of Chicago to see which areas have the most amount of crime. We will require two packages for the mapping, namely maps, and ggmap. We will also use two more packages, dplyr, and tidyr.
I will be using the Motor Vehicle Theft Data from Chicago, which can be obtained from the City of Chicago Data Portal.
The first part of the code is the same as my previous article.
The second part of the code will contain the following steps:
- Removing empty locations. For some thefts, the location is not recorded, and the field is left blank. This caused problems for me later on, so I decided to remove all such locations. At the time of writing, empty locations made up about 2500 entries of the total 278000 entries.
- Splitting the location column into latitude and longitude. The location column consists of data in the form (x, y) and is of the character class. We want x and y to be in separate columns and be of the numeric class. We will use the dplyr and tidyr libraries for this.
- Get the map of Chicago. We will use the ggmap library for this
- Plotting the location heatmap.
Here is the code:
## Removing empty locations
chicagoMVT$Location[chicagoMVT$Location == ''] <- NA
chicagoMVT <- na.omit(chicagoMVT)
We set all empty values to NA, and then change the original dataset so that it no longer contains the NA values.
## Splitting location into latitude and longitude
chicagoMVT <- chicagoMVT %>% extract(Location, c('Latitude', 'Longitude'), '\\(([^,]+), ([^)]+)\\)')
chicagoMVT$Longitude <- round(as.numeric(chicagoMVT$Longitude), 2)
chicagoMVT$Latitude <- round(as.numeric(chicagoMVT$Latitude), 2)
%>% is called the pipe operator. It is from the dplyr package. The above line of code is the same as writing
chicagoMVT <- extract(chicagoMVT, Location, c('Latitude', 'Longitude'), '\\(([^,]+), ([^)]+)\\)')
As we can see, the pipe operator is very helpful to pass output resulting from one operation to another. While it isn’t particularly useful here, it’s usefulness becomes apparent when you have to perform multiple operations, and don’t want to create a temporary variable for the result of each of the operations. I will do a short of tutorial and demonstration of dplyr in my next article.
The extract method is from the tidyr package, and I am using it to separate the Location column into Latitude and Longitude. The last parameter of the extract method is a Regular Expression or RegEx for short. I often have problems with RegEx, and this time was no different, and I’d like to thank StackOverflow user nongkrong for helping me with that.
Both dplyr and tidyr are great packages written by Hadly Wickham, the man who revolutionised R. I highly recommend that you check out his body of work and read his books.
Next, we will get the map of Chicago, so that we plot on top of it.
library(ggmap)
chicago <- get_map(location = 'chicago', zoom = 11)
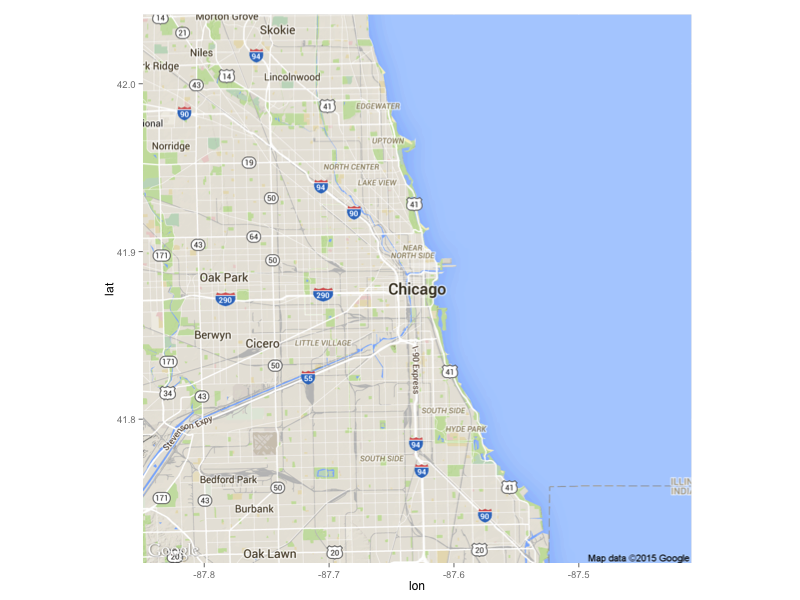
If you would like to see the map, you can use this command:
ggmap(chicago)
which will give the following map
Now we will create a data frame containing the coordinates of all the thefts.
locationCrimes <- as.data.frame(table(chicagoMVT$Longitude, chicagoMVT$Latitude))
names(locationCrimes) <- c('long', 'lat', 'Frequency')
locationCrimes$long <- as.numeric(as.character(locationCrimes$long))
locationCrimes$lat <- as.numeric(as.character(locationCrimes$lat))
locationCrimes <- subset(locationCrimes, Frequency > 0)
As we saw in the above map, the axes are named ‘long’ and ‘lat’, so we will use the same naming convention for our data frame. When we create the data frame, the latitude and longitude get converted to the factor class. To convert it back to numeric, we have to first convert them back to character, and then to numeric (otherwise it will give an error). Finally, we remove all data points where there were no crimes recorded. If you don’t do this, the resulting plot will have a lot of tiles plotted on the water, which we don’t want.
ggmap(chicago) + geom_tile(data = locationCrimes, aes(x = long, y = lat, alpha = Frequency),
                           fill = 'red') + theme(axis.title.y = element_blank(), axis.title.x = element_blank())
alpha = Frequency will set how transparent/opaque each tile is, based on the frequency of crimes in that particular area.
theme(axis.title.y = element_blank(), axis.title.x = element_blank()) will remove the titles for the axes.
This will generate the following plot:
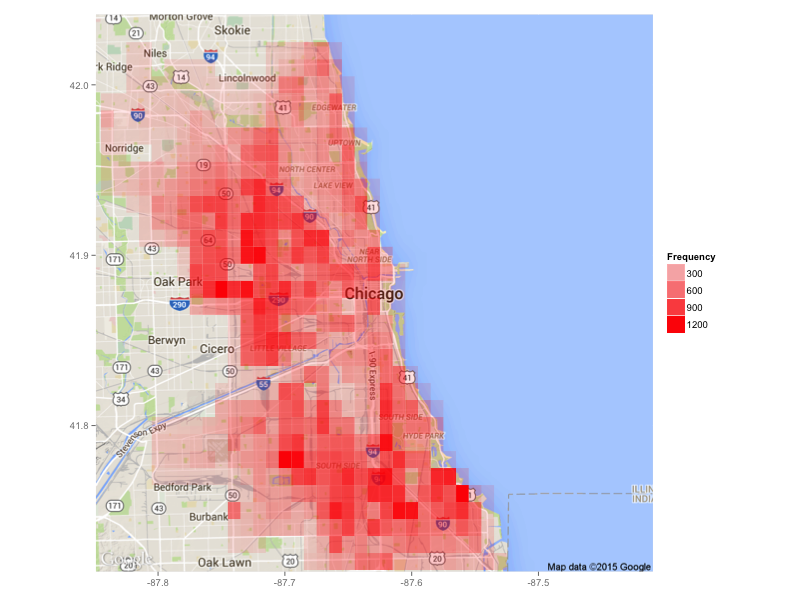
The plot gives us a pretty good idea of which areas are the most prone to thefts, and thus should be avoided. The police are using advanced crime prediction algorithms to predict where crimes will happen, and prevent them before they occur. Here is a great article by MIT Technology Review on the topic.
The full repo can be found on GitHub.
That’s it for now! I hope you enjoyed the article, and found it helpful. Feel free to leave a comment if you have any questions or contact me on Twitter!
Note: I learnt this technique in The Analytics Edge course offered by MIT on edX. It is a great course and I highly recommend that you take it if you are interested in Data Science!


On Splitting location part, missing “chicagoMVT <-" ?
chicagoMTV % extract(Location, c(‘Latitude’, ‘Longitude’), ‘\(([^,]+), ([^)]+)\)’)
Looks like there is a type in your code. You have chicagoMTV on the left instead of chicagoMVT.
Yeah, meant to have chicagoMVT.
In my case, I had to do
“chicagoMVT % extract ~”
Otherwise latitude and longitude will be displayed on console and nothing will change on existing one.
Anyways, thanks for helpful tutorial.
Yes, my apologies. I edited the post now to make it clearer.
I used the following code for getting the crime data, exactly the same as yours but i am getting an error.
locationCrimes = 2^31 elements
How do i overcome this problem in R?
Hmmm, the only reason I can think of that happening is if there are too many combinations. Did you make sure to round down the latitude and longitude to 2 digits?
Yes sir. I used the round function, just as you did. Can I have your number? I had some other queries regarding heatmaps. I guess you could help me out.
Correct me if I’m wrong, but you haven’t actually used any dplyr functions? (in before %>% — that’s magrittr)
You are correct. %>% is originally from magrittr. dplyr used to have %.%, but it was removed, and now it just exports %>% from magrittr. Hence, using magrittr here instead of dplyr would work too!
Nice tutorial.
Great tutorial, thanks.
There is a minor error in Frequency when removing all data points where there were no crimes recorded.
Your code is
locationCrimes 0)
but I guess you mean
locationCrimes 0)
Sorry for bothering you.
I don’t see the code I wrote, the problem that you wrote Freq instead of Frequency
subset(locationCrimes, Freq > 0)
subset(locationCrimes, Frequency > 0)”
Hello dieza, you are correct! Thank you for bringing to my attention, I have fixed it, and I’m glad you enjoyed the tutorial!