In the last tutorial, we developed a simple shiny App to provide a tool to collect and analyze PubMed data. There was some interest in learning more about RISmed itself, so I’ll back up a little and present some of the core RISmed package.
About PubMed and RISmed
PubMed is a public query database of published journal articles and other literature maintained and made available by the National Institutes of Health. The RISmed packages extracts content from the Entrez Programming Utilities (E-Utilities) interface to the PubMed query and database at NCBI into R. You will find great tutorials to get RISmed up and running by checking out this introduction or this very nice post by some dude named Dave Tang. For raw code, you can find Stephanie Kovalchik’s terrific RISmed github page here.
Introducing EUtilsSummary
RISmed allows us to call the EUtilsSummary() function to produce an object for us to analyze. EUtilsSummary() is overloaded with many arguments. First, we send a character string in quotes as the word/phrase/acronymn/author for which we wish to search PubMed. Here we will stick with type=esearch.
You can click the links above to learn more about arguments to EUtilsSummary(), here we are choosing PubMed, specifying a date range, and stopping after 500 publications are found.
library(RISmed)
res <- EUtilsSummary("pinkeye", type="esearch", db="pubmed", datetype='pdat', mindate=2000, maxdate=2015, retmax=500)
Now we have an object called res of class “Medline”. We can call QueryCount() to see how many publications we found.
QueryCount(res)
23
There are 23 publications in PubMed between 2000 and 2015 that contain the word “pinkeye”.
Introducing EUtilsGet
The Medline class collects pertinent information about the publications in our search, and stores the information conveniently for analysis. We can access our data by calling EUtilsGet(). Here we create a new object t that is a character vector containing all the publication titles by using the EUtilsGet() function inside ArticleTitle(). We can access them like any other character vector.
t<-ArticleTitle(EUtilsGet(res))
typeof(t)
head(t,1)
t[2]
"character"
"Infectious bovine keratoconjunctivitis (pinkeye)."
"Moraxella spp. isolated from field outbreaks of infectious bovine keratoconjunctivitis: a retrospective study of case submissions from 2010 to 2013."
res contains a lot of data relating to dates. For instance, we can access the year a publication was received, or the year it was accepted into the PubMed database.
y <- YearPubmed(EUtilsGet(res))
r <- YearReceived(EUtilsGet(res))
y
r
2015 2014 2013 2012 2011 2011 2011 2010 2010 2010 2010 2008 2008 2008 2008 2007 2007 2007 2007 2006 2005 2004 2002
NA   NA 2012 2012 2011 2011   NA 2010   NA   NA   NA   NA 2008 2007   NA 2007 2007 2007   NA   NA 2004   NA   NA
Be mindful of your data! If you make a plot of the number of documents received for publication in a given year, you can easily be missing many publications that simply don’t have that info recorded (this happens quite often). I suggest using YearPubmed, because it seems to have very few (if any) NA’s.
It’s a little tough to see a pattern in the YearPubmed results above, here is code to make a barplot.
library(ggplot)
date()
count<-table(y)
count<-as.data.frame(count)
names(count)<-c("Year", "Counts")
num <- data.frame(Year=count$Year, Counts=cumsum(count$Counts))
num$g <- "g"
names(num) <- c("Year", "Counts", "g")
q <- qplot(x=Year, y=Counts, data=count, geom="bar", stat="identity")
q <- q + ggtitle(paste("PubMed articles containing \'", g,            "\' ", "= ", max(num$Counts), sep="")) +
     ylab("Number of articles") +
     xlab(paste("Year \n Query date: ", Sys.time(), sep="")) +
     labs(colour="") +
     theme_bw()
q
Here is the plot we made.
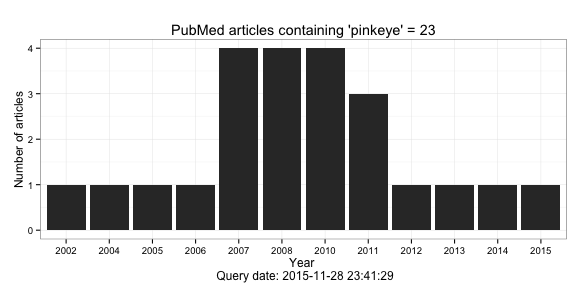
The interesting thing about this (slightly contrived) plot is that there is a sudden increase in publications in 2007 that lasts for a few years. This is the sort of thing we might want to investigate. We might take a look at term frequencies to see if there were any differences between 2006 and 2007.
Introducing text mining
Here is a function that takes a year as an argument and returns the twenty most frequent words in the abstracts for that year, after some manipulations.
library(qdap)
myFunc<-function(argument){
articles1<-data.frame('Abstract'=AbstractText(fetch), 'Year'=YearPubmed(fetch))
abstracts1<-articles1[which(articles1$Year==argument),]
abstracts1<-data.frame(abstracts1)
abstractsOnly<-as.character(abstracts1$Abstract)
abstractsOnly<-paste(abstractsOnly, sep="", collapse="")
abstractsOnly<-as.vector(abstractsOnly)
abstractsOnly<-strip(abstractsOnly)
stsp<-rm_stopwords(abstractsOnly, stopwords = qdapDictionaries::Top100Words)
ord<-as.data.frame(table(stsp))
ord<-ord[order(ord$Freq, decreasing=TRUE),]
head(ord,20)
}
Let’s run our function twice and compare.
oSix<-myFunc(2006)
oSeven<-myFunc(2007)
all<-cbind(oSix, oSeven)
names(all)<-c("2006","freq","2007","freq")

all
                   2006 freq          2007 freq
10               bovine    6         bovis   12
38           infectious    6        calves   11
42 keratoconjunctivitis    6             m    8
60                  qtl    4           ibk    7
14          centimorgan    3     moraxella    7
24                    f    3       vaccine    6
32             hereford    3       control    5
50            offspring    3     cytotoxin    5
2                  also    2      isolates    5
4                 angus    2       pinkeye    5
5               animals    2   recombinant    5
13               cattle    2             s    5
16           chromosome    2      analysis    4
17                 cows    2    associated    4
20              disease    2             b    4
22             evidence    2      efficacy    4
27           fstatistic    2          gene    4
31                group    2          mbxa    4
33           identified    2 phospholipase    4
41             interval    2     pilinmbxa    4
In addition to recognizing that pinkeye seems to have nothing to do with second-graders, there does seem to be a difference in the types of words that are most frequent. Articles from 2006 have words associated with generational studies of different breeds like “offspring”, “centimorgan”, “angus” and “hereford”, “f-statistic”, “group”, and “interval”. In contrast, 2007 articles have biochemistry looking terms like “ibk”, “Moraxella”, “cytotoxin”, “isolates”, “recombinant”, “gene”, “mbxa”, “phospholipase”, and even perhaps “vaccine”. Maybe the spike in articles is the result of a discovery concerning the host pathways controlled by pinkeye bacteria toxins, or the emergence of a new strategy for treatment that targets a bacterial pathway.
A good strategy might be to search words like “Moraxella” or “mbxa” to see if there is a corresponding spike before 2007. Even “bovis” might be a candidate to search 2006 for a discovery that led to the spike in scientific interest. (It doesn’t seem like the kind of topic that would warrant a nyTimes API scrub or twitter feeds, maybe in the rural Midwest only). We could investigate funding sources by searching NIH grant titles, or searching rural news sources for clues.
EUtilsGet subtleties
Another strategy in this particular case might be reviewing publications by a researcher who specializes in pinkeye. Author(EUtilsGet()) returns a list of data frames, so we need to use an inline function to extract all the names.
auths<-Author(EUtilsGet(res))
typeof(auths)
auths[3]
Last<-sapply(auths, function(x)paste(x$LastName))
auths2<-as.data.frame(sort(table(unlist(Last)), dec=TRUE))
names(auths2)<-c("name")
head(auths2)
"list"
   LastName  ForeName Initials order
1 Kizilkaya     Kadir        K     1
2      Tait Richard G       RG     2
3   Garrick  Dorian J       DJ     3
4  Fernando   Rohan L       RL     4
5     Reecy   James M       JM     5

         name
Angelos     5
Ball        3
O'Connor    3
Reecy       3
Tait        3
Casas       2
Maybe Dr. Angelos has written a review after 2006 that describes the change in interest in bovine pinkeye.
Until next time!


Such a wonderful thread to get started. Including it my teaching resources. I wonder if there is a way to save all the results in the “abstract” format and store them as a text file. I want to use that abstracts.txt file as an input to pubmed.mineR. Any inputs on that will be appreciated.
I think you need
fetch = EUtilsGet(res)
else the function won’t work
Hi, I am trying to crawl pub med articles, not abstracts, with constraints to word strings that pertain to target genes, mechanisms of action, and disease indications. Is there a way to use the abstract code and apply it to all the articles in a PubMed search query?
Hi, thanks for the post. Very nice way of getting things done using R and RISmed package.
I would like to ask a question. How can I extract the date of article acceptance and publication (there are the ways to extract year, day but I find no way to extract date altogether )
Many thanks.
Hi Rafik, I’m glad you like the post.
To my knowledge, RISmed doesn’t return the entire date, but you can construct the dates and then change them to date types. This page will help
Also check out lubridate.
Many thanks Aaron.
All the best