In part one of a series of tutorials, we will develop a Shiny App for performing analysis of academic text from PubMed. There’s no shortage of great tutorials for developing a Shiny App using R, including Shiny’s own tutorial. Here at DataScience+ we have a perfect introduction by Teja Kodali and a more in-depth development by J.S. Ramos. Here I will focus on the basics of making PubMed queries using the RISmed package, and to demonstrate how easily you can share any of your R functionality using Shiny. Click here to see the App in action and follow along (the App has recently been updated, to get the new code, visit my github page). In this introductory tutorial, we’ll get a taste of what we can accomplish, try to cover all the basics, and hopefully streamline some potential time-sinks.
About PubMed and RISmed
PubMed is a public query database of journal articles and other literature maintained and made available by the National Institutes of Health. The RISmed packages extracts content from the Entrez Programming Utilities (E-Utilities) interface to the PubMed query and database at NCBI into R. You will find great tutorials to get RISmed up and running by checking out this introduction or this very nice post by some dude named Dave Tang. You can find Stephanie Kovalchik’s terrific RISmed github page here. PubMed is a perfect place to search for scientific and health-related text, and coupled with Natural Language Processing tools in R, we can create powerful Meta-Analyses. Let’s get started!
Placeholder UI
Creating a shiny app requires the customary server.R and ui.R scripts in an empty directory. We will tackle the user interface head-on in the next post, so for now let’s get up and running with the following:
library(shiny)
library(shinythemes)
shinyUI(fluidPage(theme=shinytheme("united"),
        headerPanel("PubMed Search"),
        sidebarLayout(
        sidebarPanel(
        helpText("Type a word below and search PubMed to find documents that contain that word in the text. You can even type multiple words. You can search authors, topics, any acronym, etc."),
        textInput("text", label = h3("Keyord(s)"), value = "carson chow"),
        helpText("You can specify the start and end dates of your search, use the format YYYY/MM/DD"),
        textInput("date1", label = h3("From"),value="1990/01/01"),
        textInput("date2", label = h3("To"),  value = "2015/11/07"),
        helpText("Now select the output you'd like to see. You can see a barplot of articles per year, a wordcloud of the abstract texts, or a table of the top six authors"),

        actionButton("goButton","PLOT"),
        actionButton("wordButton","WORDS"),
        actionButton("authButton","AUTHORS")),

        mainPanel(
        plotOutput("distPlot"),
        plotOutput("wordPlot"),
        tableOutput("authList")

        )
        )))
We are designing an out-of-the-box Shiny UI with text entry boxes that allow the user to type their keyword(s), and specify a time frame using a start date and end date. We need to provide action buttons for users to select the output of their search instead of running it automatically, otherwise we run the risk of offending the E-Utilities servers with too many searches per second as the user types their query word (and looking glitchy in the meantime).
Act I
We will go through the server.R code in three parts, and demonstrate the RISmed package as we go. Basically we are developing three calls to E-Utilities, one for each action button on the UI. After loading all necessary packages, we activate the distPlot output expression for the user’s keyword when the user clicks the goButton action button, which the user sees on the UI as “PLOT”. RISmed then searches PubMed, and we construct a barplot of documents per year and add a line representing the sum of documents to date containing that keyword:
library(shiny)
library(SnowballC)
library(qdap)
library(ggplot2)
library(RISmed)
library(wordcloud)

shinyServer(function(input, output) {
word1<-eventReactive(input$goButton, {input$text})
  output$distPlot <- renderPlot({
  d1<-input$date1
  d2<-input$date2

  res <- EUtilsSummary(word1(), type="esearch", db="pubmed", datetype='pdat', mindate=d1, maxdate=d2, retmax=500)
  date()
  fetch <- EUtilsGet(res, type="efetch", db="pubmed")
  count<-table(YearPubmed(fetch))
  count<-as.data.frame(count)
  names(count)<-c("Year", "Counts")
  num <- data.frame(Year=count$Year, Counts=cumsum(count$Counts))
  num$g <- "g"
  names(num) <- c("Year", "Counts", "g")

  q <- qplot(x=Year, y=Counts, data=count, geom="bar", stat="identity")
  q <- q + geom_line(aes(x=Year, y=Counts, group=g), data=num) +
  ggtitle(paste("PubMed articles containing '", word1(), "' ", "= ", max(num$Counts), sep="")) +
  ylab("Number of articles") +
  xlab(paste("Year n Query date: ", Sys.time(), sep="")) +
  labs(colour="") + theme_bw()

  q
  })
Here is the plot we made:
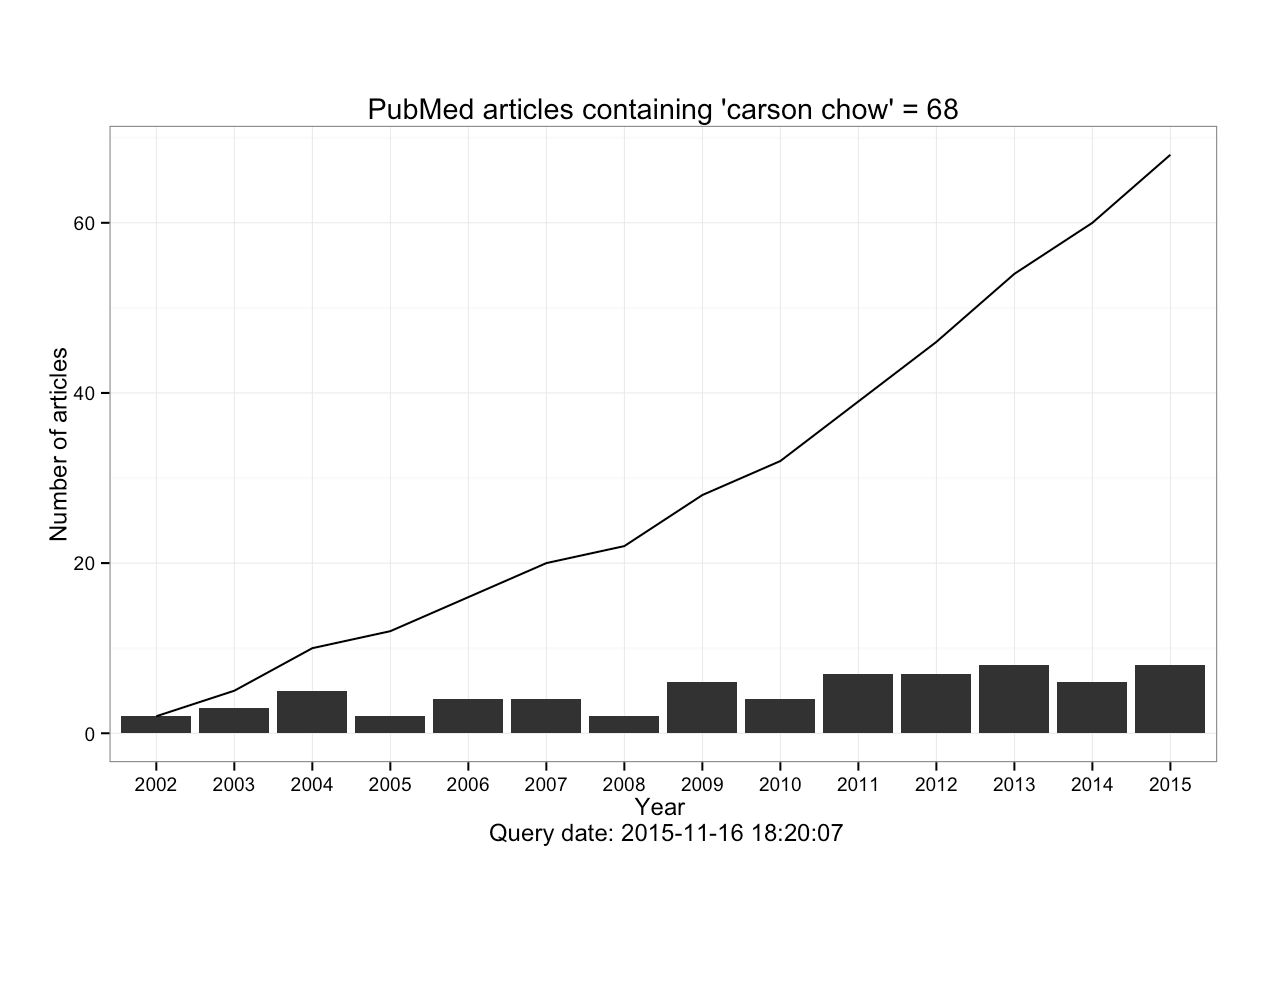
We have created an object res that contains the results of the EUtilsSummary function in RISmed, according to its arguments. In our case we are searching for the user’s keyword using an esearch, specifying the PubMed database (there are others), and we wish to search by date of publication to PubMed in the user’s date range (be sure to use YearPubmed to avoid NA’s). We will timestamp the user’s query on the plot using date(). Then we create another object called fetch, where we store the results of the EUtilsGet function that performs an efetch on our summary. This fetch object is sub-settable, and the year it was published to PubMed is accessed by YearPubmed. We use the table function to count the number of documents for each year to construct our plot. RISmed is more than just a wrapper for E-Utilities, it provides a seamless query and produces organized output ready for us to analyze.
Act II
In the second section of server.R, we produce a wordcloud of the most frequent terms in the abstracts of the documents that contain the user’s keyword. Again, we will wait to construct the wordcloud until the user clicks wordButton, which is the action button labeled “WORDS” on the UI:
word2<-eventReactive(input$wordButton, {input$text})
  output$wordPlot<-renderPlot({
  d1<-input$date1
  d2<-input$date2

  res <- EUtilsSummary(word2(), type="esearch", db="pubmed", datetype='pdat', mindate=d1, maxdate=d2, retmax=500)
  fetch <- EUtilsGet(res, type="efetch", db="pubmed")
  articles<-data.frame('Abstract'=AbstractText(fetch))
  abstracts<-as.character(articles$Abstract)
  abstracts<-paste(abstracts, sep="", collapse="")
  wordcloud(abstracts, min.freq=10, max.words=70, colors=brewer.pal(7,"Dark2"))
  })
Here is the wordcloud:
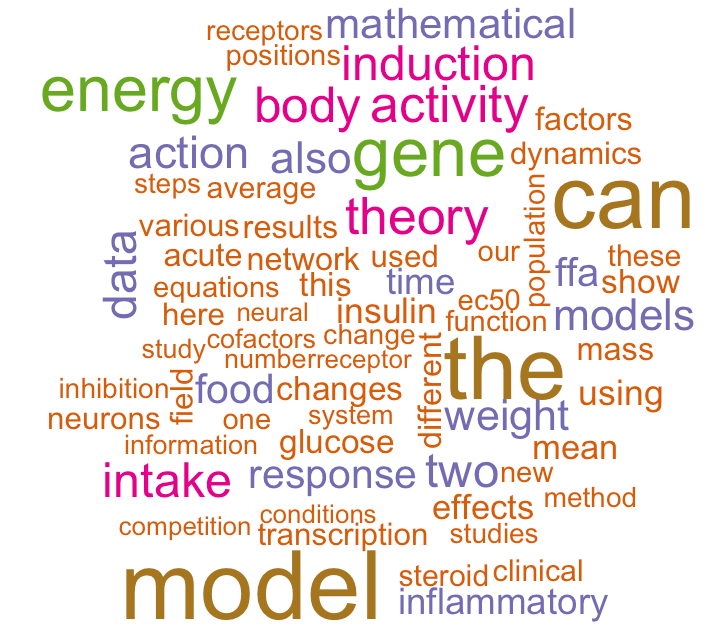
Recall that in our first search, we accessed the publication years using YearPubmed(fetch), now we access the abstracts using AbstractText(fetch). This is the beauty of RISmed, we can access many fields of an EUtilsGet object in our R environment using the approach above. This documentation page, as well as googling RISmed is a good place to learn more. Shiny then easily allows us to share our findings and add interactivity.
Act III
Wordclouds are a fun way to visualize common words, and get a qualitative sense of the words associated with the user’s keyword. Future analyses will require that our outputs be in data frames, so in anticipation we will produce our third output in tabular format. When the user clicks the authButton action button titled “AUTHORS” on the UI, we again pass the user’s keyword to a new EUtilsSummary, and grab the author names using Author(fetch):
word3<-eventReactive(input$authButton, {input$text})
  output$authList<-renderTable({
  d1<-input$date1
  d2<-input$date2

  res <- EUtilsSummary(word3(), type="esearch", db="pubmed",
datetype='pdat', mindate=d1, maxdate=d2, retmax=500)
  fetch <- EUtilsGet(res, type="efetch", db=" pubmed")
  AuthorList<-Author(fetch)
  Last<-sapply(AuthorList, function(x)paste(x$LastName))
  auths<-as.data.frame(sort(table(unlist(Last)), dec=TRUE))
  colnames(auths)<-"Count"
  auths <- cbind(Author = rownames(auths), auths)
  rownames(auths) <- NULL

  auths<-head(auths, 6)
  })
})
This is how the author table looks:
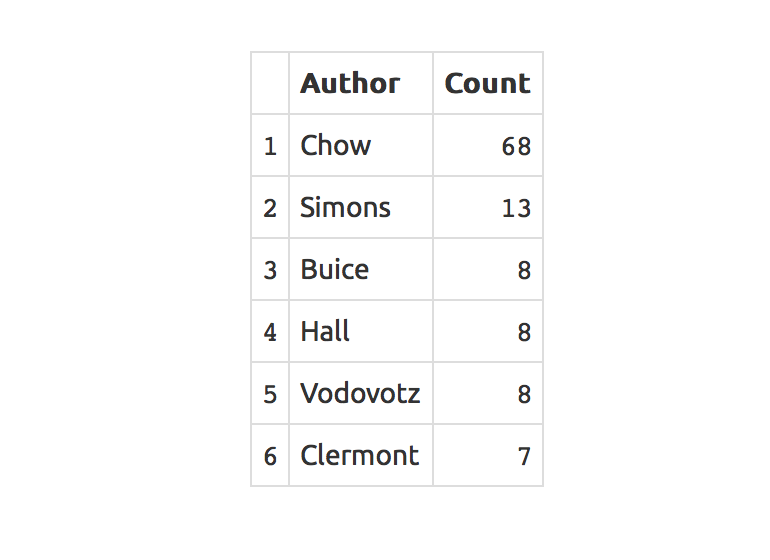
Note that RISmed stored the author information in a list (of documents) of data frames (of authors), so in this case we used sapply to extract each data frame (watch out for this occasional wrinkle).
Denouement
Remember that the most important component of our App is its benefit to the user. Here we have created a platform where a user can search a scientist’s name and quickly learn who that individual collaborates with, or collaborated with during a certain timeframe, how many publications that person has on PubMed, when they were added, as well as an idea of what type of research that scientist does. A user can also search drug names or molecule acronyms, and see the names of the researchers who are most associated with that keyword in PubMed. The user could then paste that name into the keyword box and see a wordcloud that might shed light on lab techniques or targets, or suggest that particular person’s field of interest.
Coming soon
In the next tutorial, we want to lay some groundwork for sharing future analyses by getting more control over our UI. We will see a few easy solutions provided by our good friends at Shiny, as well as walk through the process of creating a fully customized UI with our own html code. Also, check back soon for a link to a brief demonstration of this App for more ideas, and maybe some additional features.
Eventually we will be introducing other R packages that specialize in Natural Language Processing and sophisticated machine learning to peek at how data science is transforming the medical literature landscape. See you then!