R Markdown is a great tool to make research results reproducible. However, in scientific research papers or reports, tables and figures usually need to be numbered and referenced. Unfortunately, R Markdown has no “native” method to number and reference table and figure captions. The recently published bookdown package makes it very easy to number and reference tables and figures (Link). However, since bookdown uses LaTex functionality, R Markdown files created with bookdown cannot be converted into MS Word (.docx) files.
In this blog post, I will explain how to number and reference tables and figures in R Markdown files using the captioner package.
Packages required
The following code will install load and / or install the R packages required for this blog post. The dataset I will be using in this blog post is named bundesligR and part of the bundesligR package. It contains “all final tables of Germany’s highest football league, the Bundesliga” (Link).
if (!require("pacman")) install.packages("pacman")
pacman::p_load(knitr, captioner, bundesligR, stringr)
In the first code snippet, we create a table using the kable function of the knitr package. With caption we can specify a simple table caption. As we can see, the caption will not be numbered and, thus, cannot be referenced in the document.
German Bundesliga: Final Table 2015/16, Position 1-6
| Position | Team | Points | GD |
|---|---|---|---|
| 1 | FC Bayern Muenchen | 88 | 63 |
| 2 | Borussia Dortmund | 78 | 48 |
| 3 | Bayer 04 Leverkusen | 60 | 16 |
| 4 | Borussia Moenchengladbach | 55 | 17 |
| 5 | FC Schalke 04 | 52 | 2 |
| 6 | 1. FSV Mainz 05 | 50 | 4 |
Table numbering
Thanks to Alathea Letaw’s captioner package, we can number tables and figures.
In a first step, we define a function named table_nums and apply it to the tables’ name and caption. Furthermore, we may also define a prefix (Tab. for tables and Fig. for figures).
table_nums <- captioner::captioner(prefix = "Tab.")

tab.1_cap <- table_nums(name = "tab_1",
                        caption = "German Bundesliga: Final Table 2015/16, Position 7-12")
tab.2_cap <- table_nums(name = "tab_2",
                        caption = "German Bundesliga: Final Table 2015/16, Position 12-18")
The next code snippet combines both inline code and a code chunk. With fig.cap = tab.1_cap, we specify the caption of the first table. It is important to separate inline code and code chunk. Otherwise the numbering won’t work.
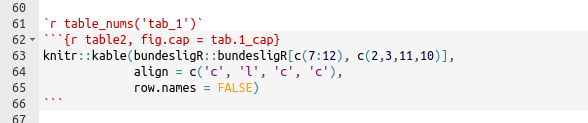
Tab. 1: German Bundesliga: Final Table 2015/16, Position 7-12
| Position | Team | Points | GD |
|---|---|---|---|
| 7 | Hertha BSC | 50 | 0 |
| 8 | VfL Wolfsburg | 45 | -2 |
| 9 | 1. FC Koeln | 43 | -4 |
| 10 | Hamburger SV | 41 | -6 |
| 11 | FC Ingolstadt 04 | 40 | -9 |
| 12 | FC Augsburg | 38 | -10 |
Table referencing
Since we have received a numbered table, it should also be possible to reference the table. However, we can not just use the inline code
table_nums('tab_1')
Otherwise, we wi’ll get the following output:
[1] “Tab. 1: German Bundesliga: Final Table 2015/16, Position 7-12”
In order to return the desired output (prefix Tab. and table number), I have written the function f.ref. Using a regular expression, the function returns all characters of the table_nums('tab_1') output located before the first colon.
f.ref <- function(x) {
  stringr::str_extract(table_nums(x), "[^:]*")
}
When we apply this function to tab_1, the inline code returns the following result:
- Inline code: As we can see in
f.ref("tab_1"), the Berlin based football club Hertha BSC had position seven in the final table. - Result: As we can see in Tab. 1, the Berlin based football club Hertha BSC had position seven in the final table.
Just to make the table complete, Tab. 2 shows positions 13 to 18 of the final Bundesliga table.
knitr::kable(bundesligR::bundesligR[c(13:18), c(2,3,11,10)],
             align = c('c', 'l', 'c', 'c'),
             row.names = FALSE)
Tab. 2: German Bundesliga: Final Table 2015/16, Position 12-18
| Position | Team | Points | GD |
|---|---|---|---|
| 13 | Werder Bremen | 38 | -15 |
| 14 | SV Darmstadt 98 | 38 | -15 |
| 15 | TSG 1899 Hoffenheim | 37 | -15 |
| 16 | Eintracht Frankfurt | 36 | -18 |
| 17 | VfB Stuttgart | 33 | -25 |
| 18 | Hannover 96 | 25 | -31 |
And what about figures?
Figures can be numbered and referenced following the same principle.
I hope you find this post useful and If you have any question please post a comment below. You are welcome to visit my personal blog Scripts and Statistics for more R tutorials.
what font did you use for this post? very nice.
I’ll have to checkout bookdown.
If you’re using captioner, this is how I do it. Works for pdf, html and docx.
Format yaml like this: (indenting is lost in Discus, look at the linked .Rmd file)
—
output:
pdf_document:
fig_caption: yes
html_document:
fig_caption: yes
word_document:
fig_caption: yes
header-includes: usepackage{caption} usepackage{float}
—
and add the LaTeX lines just below the yaml header
captionsetup[table]{labelformat=empty}
captionsetup[figure]{labelformat=empty}
then set the prefix when you call captioner
“`
library(captioner)
table_nums <- captioner(prefix = "Table")
table_nums(name = "placeholder", caption = "Placeholder")
“`
and the inline code can look like this
`r table_nums(name = "placeholder", display = "cite")`
.Rmd file here
https://1drv.ms/u/s!AvH3KgT90_z8gY8CClhYEYc1HTpjkg
Thank you!
Excellent suggestion. I have had the same problem. I am a little confused as how one incorporates the latex comments in an R script that is called by knitr::spin to generate md file which is then render using rmarkdown into pdf document. Knitr::spin does not seem to recognise the use package etc. etc.
I get error 43 when pandoc is called by rmarkdown to generate the pdf document. just looks very messy. Would have been easier just to have a simple flag in rmarkdown saying turn off figure captions
Actually, bookdown _can_ handle captions and cross-references for MS Word output. If your header YAML contains `output: bookdown::word_document2` then you can use captions and cross-references exactly as described in https://bookdown.org/yihui/bookdown/cross-references.html
No need to use captioner or any other package for captions and cross-referenceswhen rendering Rmd to MS Word, bookdown can do it all!
Exactly. https://bookdown.org/yihui/bookdown/a-single-document.html
Oh, sorry! Thanks for letting me know!