This is a tutorial for beginners interested in learning about MNIST and Softmax regression using machine learning (ML) and TensorFlow. When we start learning programming, the first thing we learned to do was to print “Hello World.” It’s like Hello World, the entry point to programming, and MNIST, the starting point for machine learning.
MNIST is an entry-level computer vision dataset that contains a variety of handwritten digital images like the following:
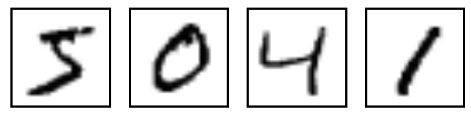
It also contains a label for each image, telling us that this is a few digits. For example, the labels for the above four images are 5, 0, 4, and 1, respectively.
In this tutorial, we will train a machine learning model for predicting numbers in pictures. Our goal is not to design a world-class complex model (although we will give you the source code to implement first-rate predictive models later). Rather, this tutorial is to introduce how to use TensorFlow. So, we start here with a very simple mathematical model called Softmax Regression.
The implementation code for this tutorial is short, and the really interesting content is only contained in three lines of code. However, it is very important to understand the design ideas contained in these codes: the basic concepts of TensorFlow workflow and machine learning. Therefore, this tutorial will explain in detail the implementation of these codes.
To complete this tutorial, some familiarity with Python will come in handy. If you haven’t worked with Python before, then you must learn Python and get familiar with it before going through this tutorial.
MNIST Data Set
The official website of the MNIST dataset is Yann LeCun’s website. From this website, you can download the Python source code for automatically downloading and installing the MNIST dataset. You can download this code and then import it into your project with the following code, or you can copy and paste it directly into your code file.
import input_data
mnist = input_data.read_data_sets("MNIST_data/", one_hot=True)
The downloaded data set is divided into two parts: 60,000 rows of training data mnist.train and 10,000 rows of test data mnist.test. Such segmentation is important. A separate set of test data must be used in the machine learning model design, not for training but to evaluate the performance of the model, making it easier to generalize the design model to other data sets (generalization).
As mentioned earlier, each MNIST data unit consists of two parts: a picture containing handwritten digits and a corresponding tag. We set these pictures to “xs” and set these tags to “ys”. Both the training dataset and the test dataset contain xs and ys. For example, the training dataset image is the mnist.train.images training dataset label mnist.train.labels.
Each picture contains 28 pixels x 28 pixels for a total of 784 pixels which in turn is represented as a 784 element array. For example, we can use an array of numbers to represent this picture with each number representing the intensity of the associated pixel’s grayscale (on a scale of 0-1).
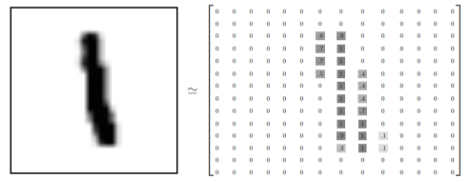
We expand this array into a vector with a length of 28×28 = 784. How or why we expand this array (the order between the numbers) is not important. Just make sure that each picture expanded into an array in the same way.
Flattening a two-dimensional structure of pixels into one-dimensional array results in the loss of the picture ’s two-dimensional nature. This is obviously not ideal, and the best computer vision methods will mine and use such structural information, which we will introduce in subsequent tutorials. However, for the purposes of a beginning tutorial, it is best to work with a single dimensional structure. The simple mathematical models introduced and the softmax regression does not require anything more complicated.
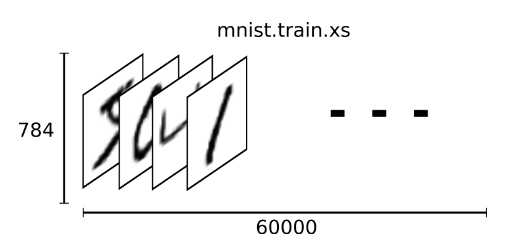
Thus, in MNIST training data set, mnist.train.images is shaped as a [60000, 784] tensor (60000 images, each involving a 784 element array). Using that syntax, you can refer to any of the pixels in any of the images. As shown above, each element in this tensor represents the intensity value of a pixel in a picture, between 0 and 1.
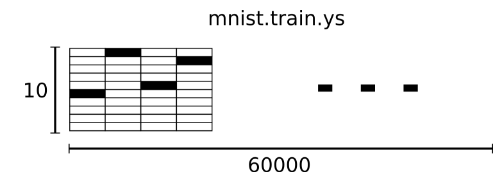
The corresponding MNIST dataset tag is a number between 0 and 9 and is used to describe the number represented in a given picture. For this tutorial, we make the tag data “one-hot vectors.” A one-hot vector is 0 except for one digit. So in this tutorial, the number n will be represented as a 10-dimensional vector with only one digit in the n-th dimension (starting from 0). For example, the label 0 will be represented as ([1,0,0,0,0,0,0,0,0,0,0]). Therefore, mnist.train.labels a [60000, 10] digital matrix.
Now we are ready to start building our model!
Softmax Regression Introduction
We know that every picture of MNIST represents a number from 0 to 9. We want to get the probability that a given picture represents each number. For example, our model may speculate that the probability of a picture containing 9 representing the number 9 is 80% but the probability of judging it as 8 is 5% (because both 8 and 9 have the small circle of the top half), and then give it Smaller values that represent other numbers.
This is a classic case using a softmax regression model. The softmax model can be used to assign probabilities to different objects. Even after we train more elaborate models, the final step also needs to use softmax to assign probabilities.
First Step in Softmax Regression
In order to get evidence that a given picture belongs to a specific digital class, we perform a weighted sum on the picture pixel values. If this pixel has strong evidence that the picture does not belong to this class, the corresponding weight is negative, and conversely, if the pixel has favourable evidence to support this picture belongs to this class, then the weight is a positive number.
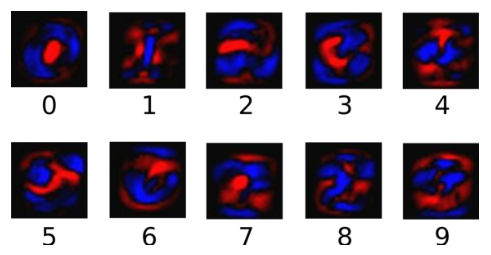
The image below shows the weight of each pixel in a picture that the model learns for a particular number class. Red represents negative weights and blue represents positive weights.
We also need to add an extra bias because the input tends to have some extraneous interference. So for a given input picture x, it represents the evidence of the number i can be expressed as
![]()
Wherein the wi representative weight bi represents a number i offset class, J behalf of a given image x pixel index for summing the pixel. Then use the softmax function to convert this evidence to the probability y :
y = softmax(evidence)
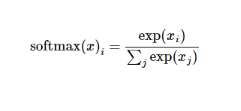
Here the softmax can be seen as an activation function or a link function that converts the output of the linear function we define to the format we want, that is, the probability distribution for the 10 digital classes. Therefore, given a picture, its fit for each digit can be converted into a probability value by the softmax function. The softmax function can be defined as:
softmax(x) = normalize(exp(x))
Expand the subtype on the right side of the equation to get:
But more often the softmax model function is defined as the former form: the input values are evaluated as exponents and the result values are then regularized. This exponentiation implies that the larger evidence corresponds to the multiplier weight value in the larger hypothesis model (hypothesis).
Conversely, having less evidence means having smaller multiplier coefficients in the hypothetical model. Assume that the weights in the model cannot be zero or negative. Softmax then normalizes these weights so that their sum is equal to one to construct an effective probability distribution.
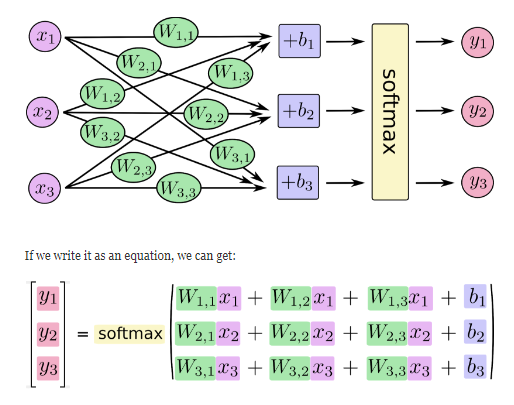
The softmax regression model can be explained by the following diagram. For the xs weighted summation of the inputs, add an offset and add them to the softmax function:
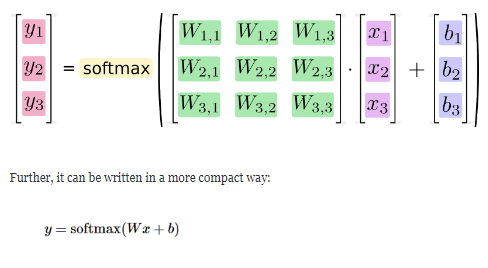
We can also express this calculation process using vectors: multiply by the matrix and add vector. This helps to increase the computational efficiency. (also a more effective way of thinking)
Implement a Regression Model
In order to implement efficient numerical calculations using Python, we usually use a library of functions, such as NumPy, which implements complex computations like matrix multiplication using other external languages. Unfortunately, switching from external calculations back to Python is still a huge overhead. If you use GPUs for external calculations, this overhead will be greater. With distributed computing, more resources will also be spent to transfer data.
TensorFlow also implements complex calculations outside of python, but it does further refinement to avoid the overhead mentioned earlier. Tensorflow does not run a single complex calculation separately but lets us use a graph to describe a series of interactive calculations and then all run outside of Python together. Before using TensorFlow, import it first:
import tensorflow as tf
We describe these interactive operating units by manipulating symbol variables. We can create one in the following way:
x = tf.placeholder("float", [None, 784])
X Not a specific value, but a placeholder, we enter this value when TensorFlow runs the calculation. We want to be able to input any number of MNIST images, each flattened into 784-dimensional vectors. We use two-dimensional floating-point tensors to represent these graphs. The shape of this tensor is [None,784 ]. ( None The first dimension here indicates that this tensor can be of any length.)
Our model also requires weights and offset values, of course, we can use them as a further input (placeholders), but there is a better way TensorFlow to represent them: Variable. One Variable represents a modifiable tensor that exists in TensorFlow’s diagram for describing interactive operations. They can be used to calculate input values and can be modified in calculations. For various machine learning applications, there are generally model parameters that can be Variable expressed.
W = tf.Variable(tf.zeros([784,10]))
b = tf.Variable(tf.zeros([10]))
We assign tf.Variable different initial values to create different ones Variable: Here, we all use the zero tensor to initialize the Wsum b. Because we want to learn Wand b value of their initial value can be freely set.
Note that W the dimension is [784,10] because we want to multiply it with a 784-dimensional picture vector to get a 10-dimensional vector of evidence values, each corresponding to a different number class. b The shape is [10], so we can add it directly to the output.
Now we can implement our model. Only one line of code!
y = tf.nn.softmax(tf.matmul(x,W) + b)
First of all, we use the tf.matmul(X,W) expression x multiplication W, corresponding to the previous equation wx, where x is a 2-dimensional tensor with multiple inputs. Then add band enter the tf.nn.softmax function into the function.
At this point, we first used a few lines of shortcode to set the variables and then used only one line of code to define our model. TensorFlow not only makes the calculation of the softmax regression model particularly simple, it also describes other various numerical calculations in this very flexible way, from the machine learning model to the physics simulation model. Once defined, our model can run on different devices: the computer’s CPU, GPU, or even on a cell phone.
Training The Model
In order to train our model, we first need to define an indicator to evaluate this model is good. In fact, in machine learning, we usually define indicators to indicate that a model is bad, this indicator is called cost or loss, and then try to minimize this indicator. However, these two methods are the same.
A very common and very beautiful cost function is cross-entropy. Cross-entropy results from the information compression coding technology in information theory, but it later evolved into an important technology in other fields such as game theory and machine learning. Its definition is as follows:
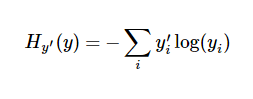
y is our predicted probability distribution, y’ is the actual distribution (our one-hot vector). The rougher understanding is that cross entropy is used to measure the inefficiency of our predictions used to describe the truth. A more detailed explanation of cross-entropy is beyond the scope of this tutorial, but you really need to understand it well here.
In order to calculate the cross-entropy, we first need to add a new placeholder for entering the correct value:
y_ = tf.placeholder("float", [None,10])
Then we can calculate the cross-entropy:
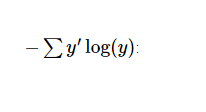
cross_entropy = -tf.reduce_sum(y_*tf.log(y))
First, tf.log calculate y the logarithm of each element. Next, we put y_ each element and tf.log(y_) corresponding elements are multiplied. Finally, tf.reduce_sum the sum of all calculated tensor elements. (Not that the cross-entropy here is not only used to measure a single pair of predictions and true values but the sum of the cross entropies of all 100 images. The prediction performance for 100 data points is better than that for a single data point. Describe the performance of our model.
Now that we know what we need our model to do, training it with TensorFlow is very easy. Because TensorFlow has a graph that describes each of your computational units, it can automatically use the backpropagation algorithm to effectively determine how your variables affect the cost value you want to minimize. Then, TensorFlow will use your optimization algorithm to constantly modify variables to reduce costs.
train_step = tf.train.GradientDescentOptimizer(0.01).minimize(cross_entropy)
Here, we require TensorFlow to use a gradient descent algorithm to minimize the cross-entropy at a learning rate of 0.01. The gradient descent algorithm is a simple learning process. TensorFlow simply moves each variable little by little in a direction that keeps costs down. Of course TensorFlow also offers many other optimization algorithms, you can use other algorithms simply by adjusting one line of code.
What TensorFlow actually does here is that it adds a series of new calculations to the back of the graph that describes your calculations for backpropagation and gradient descent. Then, it returns to you just a single operation. When running this operation, it uses the gradient descent algorithm to train your model, fine-tune your variables, and continuously reduce costs.
We have now set up our model. Before running the calculation, we need to add an operation to initialize the variable we created:
init = tf.initialize_all_variables()
Now we can Session start our model in one and initialize the variables:
sess = tf.Session()
sess.run(init)
Then start training the model, here we let the model cycle training 1000 times!
for i in range(1000):
  batch_xs, batch_ys = mnist.train.next_batch(100)
  sess.run(train_step, feed_dict={x: batch_xs, y_: batch_ys})
In each step of the cycle, we randomly grab 100 batches of data points in the training data. Then we use these data points as parameters to replace the previous placeholders train_step.
Using a small amount of random data for training is called stochastic training – more specifically, random gradient descent training. Ideally, we want to use each of our data to perform each step of the training because it gives us better training results, but obviously, this requires a lot of computational overhead. Therefore, we can use different data subsets for each training. This will not only reduce the computational overhead but also maximize the overall characteristics of the dataset.
Evaluate The Model
What about the performance of our model?
Let’s first find out which labels are correct. Tf.argmax Is a very useful function, it can give a tensor object in a certain dimension of the value of the index of its data. Since the tag is a vector consisting of 0, so the maximum value of the index position is located a category label, such as tf.argmax(y,1) the return of the model prediction for any input x to the tag value, and tf.argmax(y_,1) the representative of the correct label, we can use tf.equalto test our Whether the prediction is a true tag match (the same as the index position indicates a match).
correct_prediction = tf.equal(tf.argmax(y,1), tf.argmax(y_,1))
This line of code will give us a set of Boolean values. In order to determine the proportion of correct predictors, we can convert Boolean values to floating point numbers and then average them. For example, it [True, False, True, True] will become [1,0,1,1], get after average 0.75.
accuracy = tf.reduce_mean(tf.cast(correct_prediction, "float"))
Finally, we calculate the correctness of the learned model on the test data set.
print sess.run(accuracy, feed_dict={x: mnist.test.images, y_: mnist.test.labels})
The final result value should be approximately 91%. Is this result okay? Well, it’s not very good. In fact, this result is very poor. This is because we only use a very simple model. However, with some minor improvements, we can get a correct rate of 97%. The best model can even get more than 99.7% accuracy.
From this tutorial, you learned more about the design ideas of Softmax regression model. However, if you have any questions on this tutorial, please drop us your comment in the below comment box. We will get back to you as soon as possible. Happy learning.!
Note: I learnt this MNIST for machine learning with softmax regression tutorial from this great resource MNIST For ML Beginners by TensorFlow. It is a great tutorial and I highly recommend you to read it if you are more interested in learning Tensorflow and machine learning!
Hello…thank you for that…I would like to advise that you look at your matrix dot product
Hi. May I see your full source code ?
Thank you for an elaborate explanation. Can you explain how exactly can I tweak the model to get an accuracy of 97 or 99.7%
Where you able to figure it out?