Since I learned Markdown and use R notebook in R Studio to produce high-quality PDF report, I hoped that I am not going to use Microsoft Office anymore. In fact, by using R Markdown, I can accomplish everything, until I need to make a flowchart. A flowchart is a diagram that represents a workflow. In medical research, flowcharts are being used to show the study populations and exclusions.
After some search, I found that there are a few packages in R which allow making exemplary flowcharts. The one which I found easy to use was DiagrammeR. The advantage of this packages is that generate diagrams using code within R Markdown syntax.
Load the library
library(DiagrammeR)
Let start with a simple example and go through the code.
library(DiagrammeR)
grViz("digraph flowchart {
      # node definitions with substituted label text
      node [fontname = Helvetica, shape = rectangle]
      tab1 [label = '@@1']
      tab2 [label = '@@2']
      tab3 [label = '@@3']
      tab4 [label = '@@4']
      tab5 [label = '@@5']

      # edge definitions with the node IDs
      tab1 -> tab2 -> tab3 -> tab4 -> tab5;
      }

      [1]: 'Questionnaire sent to n=1000 participants'
      [2]: 'Participants responded to questionnaire n=850'
      [3]: 'Participants came to clinic for evaluation n=700'
      [4]: 'Participants eligible for the study n=600'
      [5]: 'Study sample n=600'
      ")

The node refers to the style of the diagram and includes the font and shape. For this example, I choose the rectangle, but I can select a square or diamond. Next, I set how many nodes (i.e., tab1, tab2,…, tab5) I need for the diagram. Then, I make the order, and finally, I create the content on each node. It is straightforward!
Another example is shown below:
grViz("digraph flowchart {
      # node definitions with substituted label text
      node [fontname = Helvetica, shape = rectangle]
      tab1 [label = '@@1']
      tab2 [label = '@@2']
      tab3 [label = '@@3']
      tab4 [label = '@@4']
      tab5 [label = '@@5']

      # edge definitions with the node IDs
      tab1 -> tab2;
      tab2 -> tab3;
      tab2 -> tab4 -> tab5
      }

      [1]: 'Questionnaire sent to n=1000 participants'
      [2]: 'Participants came to clinic for evaluation n=700'
      [3]: 'Participants non-eligible for the study n=100'
      [4]: 'Participants eligible for the study n=600'
      [5]: 'Study sample n=600'
      ")
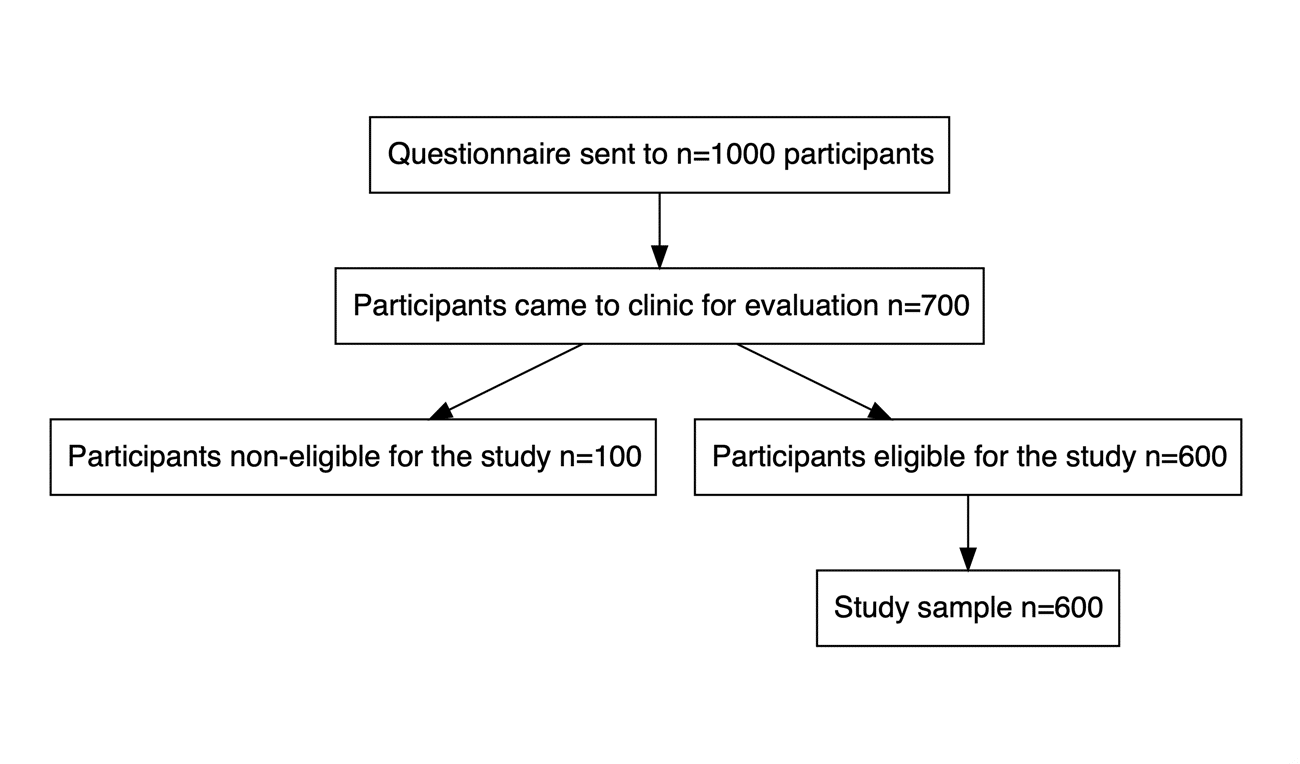
The difference from the previous example is that node 2 is followed by the two other nodes. Look at the code tab2->tab3 and tab2->tab4->tab5. There is an endless combination I can do to build more complex flowcharts.
One drawback I noticed with this package is that I cannot build the PDF notebook, but works well for HTML. If someone knows how to include this on PDF, it would be great if you share it here. To learn more about DiagrammeR follow this link.
If you have questions, please post a comment.
install.packages(“webshot”)
webshot::install_phantomjs()
use this for generating PDF’s. It worked for me, hope this will work for you.
Cheers!
Wrap your text with “\n” as in ‘Questionnaire sent to \nn=1000 participants’
I really like this package. How do you wrap text within boxes? I tried br between the greater and less than signs within the quoted text for the box and that did not work.
Really love DiagrammR, my only problem is the same as yours, no way to easily add them to .docx or .pdf. The only way I found it to work was by exporting it to a png and include that which is definitely not perfect…