We all know R is the first choice for statistical analysis and data visualisation, but what about big data munging? tidyverse (or we’d better say hadleyverse) has been doing a lot in this field, nevertheless it is often the case this kind of activities being handled from some other coding language. Moreover, sometimes you get as an input pieces of analyses performed with other kind of languages or, what is worst, piece of databases packed in proprietary format (like .dta .xpt and other). So let’s assume you are an R enthusiast like I am, and you do with R all of your work, reporting included, wouldn’t be great to have some nitty gritty way to merge together all these languages in a streamlined workflow?
Yes, we all know great products like Microsoft Azure and sas Viya, but you know what? They don’t come free, and this can sometime become an obstacle. Moreover all of them involve some kind of sophisticated setup to go trough. But what if we could reach some useful results just leveraging a useful r package and a cleaver setup? We actually can do this and I’ll show you how within coming paragraphs.
The main character: rio package
I met rio package some years ago, and since then, I never stopped using it. What rio package basically does is automagically guessing the file type you are trying to import and subsequently calling the proper function to effectively import within your R workspace. All you have to do is running the import() function, enclosing in brackets the complete path to your data file, or relative path if within your working directory. be sure to include file extension within the path string.
As import(), rio also comes with an export() function, which does exactly what you are guessing: exporting your r object into a user-defined file. to complete the suite we find convert() which takes a file as input and convert it into a user-defined output file.
How all this comes in help for our purposes? this is actually our main block: we are going to use rio to transform output from one given language into the input for R scripts or any other language. so what about the second block, our cleaver setup?
The ancillary character: a cleaver setup
So at the moment we know how to take non-R output as R-input and how to export R output to non-R languages, but how do we structure this in an ordered and clear manner? I came up with the following logical flow:

The data step
As you can see we first have a data step. this logical step involves keeping all data pieces in one physical location which all languages script will have to reference to get and release data files. We are going to teach to every language to point to that location when data loading or production is involved.
The coding step
The second step is represented by some languages logos. it stands for the logical step involving actual code production from different languages. within this step we consider different scripts, each of them performing its tasks pointing to the common data location. For sure we have to recognise the R script prominence, since within this script we convert, if needed, data coming from for instance from sas to data eatable from spss. it could even be the case that a proper R script is set aside only to perform this kind of task, without impacting our “real” R script where real analyses are performed.
Why do we have arrows coming and going from first and second step? simply because every language can take and put files into data location.
The reporting step
last step is the reporting one: your analyses are finalised and you want to share them with your stakeholder, what are you going to use for it? If you are a real R enthusiast you will for sure fire up an Rmarkdown file, and our logical flow is here to help.
Rmarkdown is a powerful tool which combines main advantages of markdown with powerful features of R languages. You can actually dynamically embeed R code results within you markdown file, having the R code recompiled every time you compile the main file. This means that if your analyses changes your report will change as well, and everything will always be in sync without requiring you to get trapped within the copy and paste swamp.
Where your report will take the needed data from? from data location, of course. and this complete our workflow. But now let’s have a look to a real example:
A real example: linking togheter R and sas
We start our analysis munging some heavy data within sas environment. We read our data from a txt/csv file into sas, creating two sas7bdat tables which we need to merge togheter in order to associate dimensional data to some kind of customer list. so we run our two or three data step and we end up having one complete table. This table, in was language will be referenced as data.complete_data. We now want to apply some cool and trending statistical models on this data, just to show we are real data scientists, where should we do this if not in R? So here we go, creating a new R script and loading our data in. How do we do it? Leveraging rio! we will have just to run the following line of code, leaving all the hard job to the package:
complete_data <- import('data/complete_data.sas7bdat')
This line of code will create a data.frame object ready to be analysed with our favourite language. and now it’s time to go for the last step: reporting analyses results. this is actually an easy step, since we could also merge it with the r script one: once we can read our sas-munged data into R why not readying them directly within the Rmarkdown file? Anyway, we can handle the last step in different complementary ways:
- producing all final results within a separate R script and saving them to an Rdata object to be loaded within the Rmarkdown file
- producing pieces of results in sas and R joining them only within the Rmarkdown file through the import() function.
- performing the whole analyses from munged data within the Rmarkdown file.
The trade-off you have to consider when choosing within this continuum is between weight and flexibility: loading final results into rmarkdown will may results in lighter objects then raw datasets but will also generally reduce the possibility to let the user interact with your data, for instance with interactive components like the ones from shiny framework. as is often the case, the experience will teach you how to move from one side to the other.
Ok, so everything seems finalised, doesn’t it? not quite, since we have a bonus track: the workfloweR experiment.
Bonus track: the workfloweR experiment
Since I often use more than one programming language when performing my job and I am a lazy programmer, I decided to automize a bit all the workflow described within previous paragraph, that is where workfloweR comes from.
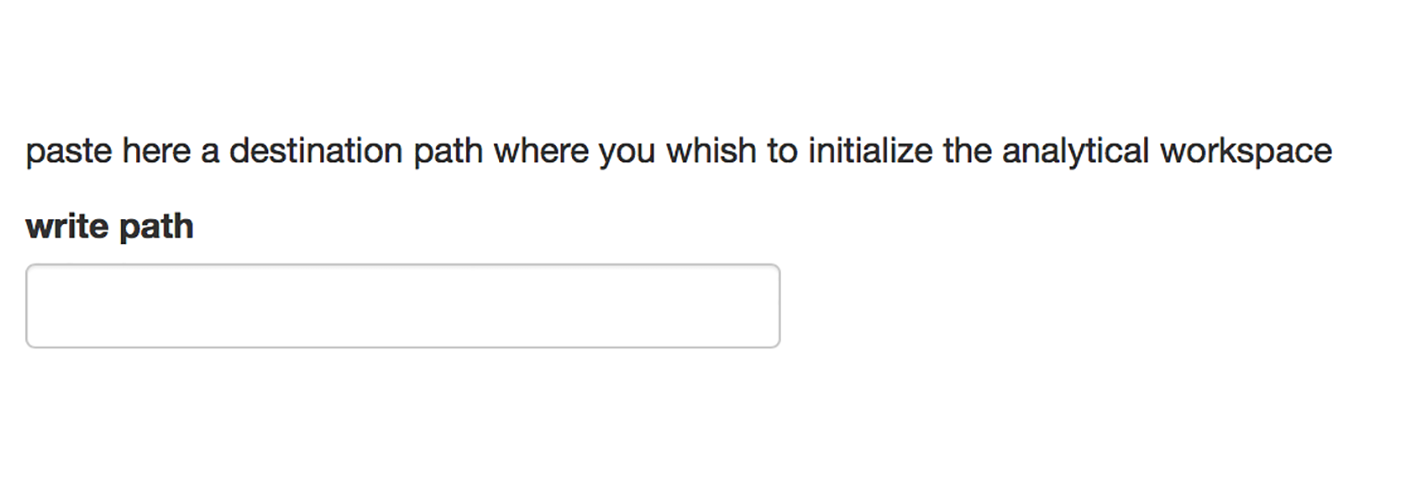
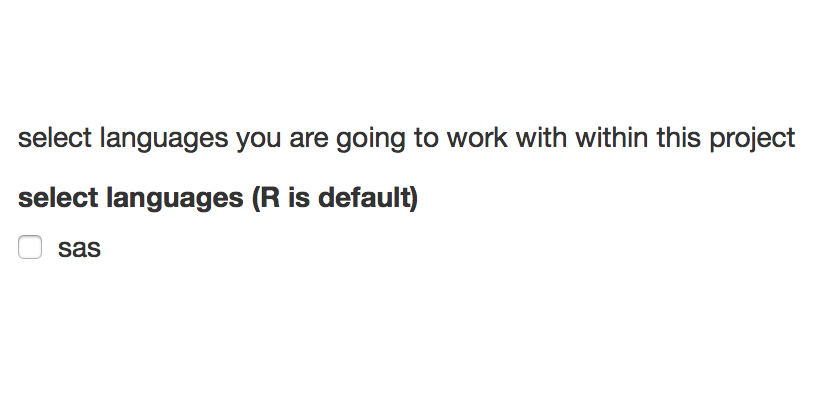
What it does is asking you ( through a simple shiny app) to define a path where you would like to initialize the analysis workspace and select languages you are going to use for your analyses. Once the selection is done and the usual initialize button is pressed, workfloweR takes care of creating within submitted path all needed data folders and languages scripts. It morover adds proper references to data folder within different scripts, for instance employing the libname statement to create a sas library within the sas script. finally, worflower creates an rmarkdown report ready to be employed to share results of your wonderful work.
How to try workflower
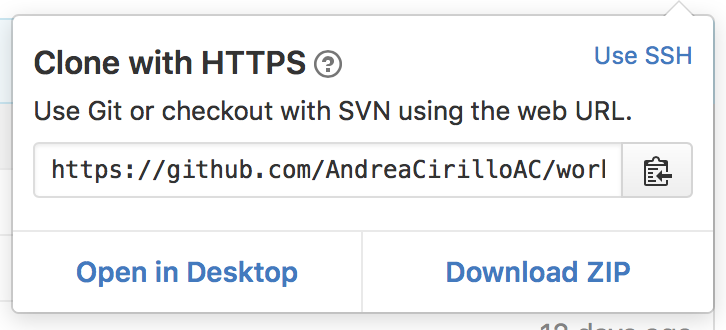
An updated version of workflower is currently hosted on Github an you can try it following this steps:
Clone or download the repository from Github
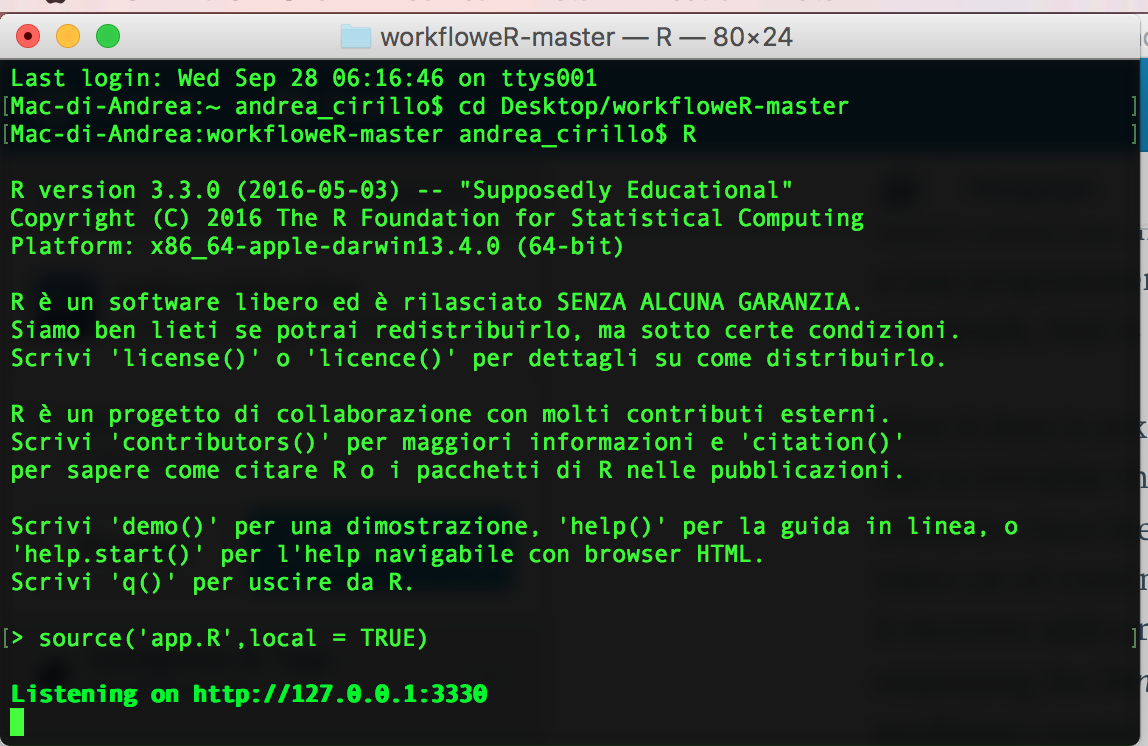
source ‘app.R’
specify where to initialize your analysis workspace
specify the languages you are going to use for your analyses
initialize the workspace

enjoy !
Just open up your pre-initialised R or sas scripts and start performing you analyses. When you will be done with your work an Rmarkdown file will be waiting for you within the deliverable folder.
May I ask for your help?
If you enjoy the idea of workflower, would you mind give me an help to further expand it? As mentioned you can find the project on github, feel free to clone it and work on it. I can see two main developement paths:
- Move the all stuff into an R package, which will make its use really easy directly from Github via devtools
- Add more languages beside R and sas.
Languages integration is a powerfull way to let best feature of each one shine, that’s why I thought it was a good idea to share this pragmating and simple approach to exchange data an sum up results from analyses performed with R and other languages. Let me know if you find it useful or if you have got any other similar trick.