In this post, I will show you how to create an animation using R and ffmpeg. The idea to do so is pretty simple:
- Generate a number of snapshots
- Combine them in a video file using ffmpeg
- Please note that I have used a Windows machine for this post
The best way to learn about the art of animation is by doing it ourselves, so our work example is the infamous Broken Stick Problem.
Here is the scenario:
Let there be a stick of length 1. Pick two points uniformly at random along the stick and break the stick at those points. What is the probability of the three resulting pieces being able to form a triangle? In the first part of this post, I will provide my analytical approach to calculate the probability. Then in the second part, I will use Monte Carlo simulation to reach to the answer.
Analytical Solution
The triangle inequality states that for any triangle, the sum of the lengths of any two sides must be greater than the length of the remaining side. Let’s suppose that , the vertices of our triangle could have the following lengths: . For the three pieces to form a triangle, none of them should have a length less than half. In order words the following conditions must be satisfied: (a) (b) (c) (d) Sum of the 3 vertices is equal to 1.
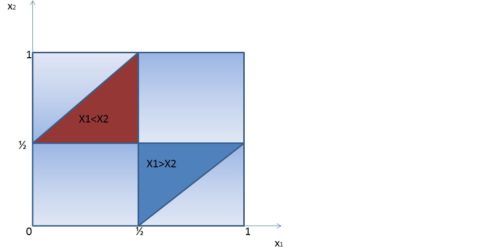
The above conditions could also be established for the case where . The diagram below displays the above conditions. Our areas of interest are derived by finding the intersection where conditions (a)-(d) are valid, hence giving us the probability of obtaining a triangle under such conditions.
Looking at the two areas (red and blue) above, the probability of obtaining a triangle is:
Simulated Solution
The estimation of the probability is done using a Monte Carlo algorithm. Here is my proposed approach to solve this problem:
- Generate 2 random points from a uniform distribution between 0 & 1
- Check whether the 2 two values obtained satisfy conditions (a)-(d); if yes give 1 to that pair otherwise give 0
- Compute the cumulative empirical probability
- Repeat the above steps multiple times (in this case 1000 times)
The R-code is as follows:
suppressPackageStartupMessages(require(ggplot2))
set.seed(2016)
index_Score <- function(){
  # Picking 2 points randomly on the stick at the same time
  x <- runif(n = 2, min = 0, max = 1)
  a <- min(x) # first point
  b <- max(x) # second point
  # pieces of the stick with their respective length
  pieces <- c(a, b-a, 1-b)
  cond1 <- sum(pieces[c(1,2)]) > pieces[3] # condition # 1
  cond2 <- sum(pieces[c(1,3)]) > pieces[2] # condition # 2
  cond3 <- sum(pieces[c(3,2)]) > pieces[1] # condition # 3
  combine_conds <- ifelse(cond1 & cond2 & cond3, 1, 0) # if all 3 conditions are satisfied
  return(combine_conds)
}

cnt <- c()
total <- 1000
for(k in 1:total) cnt = c(cnt, index_Score())
df <- setNames(data.frame(1:total, rep(0, total)), c("Incrmt","Probs"))
for (i in 1:total)  df$Probs[i] <- sum(cnt[1:i])/i
Copy
The final step consists of generating the snapshots (1000 of them) depicting the iterations and the cumulative probabilities and encoding these images into a video format.
for(i in 1:total) {
  sub_df <- subset(df, df$Incrmt <= i)
  simul_plot <- qplot(Incrmt, Probs, data = sub_df, geom = "path") +
    labs(x = "iterations", y = "Probabilities", title = "Monte Carlo Simulation") + ylim(c(0,0.4)) +
    geom_hline(yintercept = 0.25, colour = "red", linetype = "longdash")
  ggsave(plot = simul_plot, filename = paste(sprintf("images/brokenstick_%02d",i),".png", sep = ""), limitsize = FALSE)
  rm(sub_df)
  dev.off()
}
Copy
ffmpeg is quite a nice tool which can be installed in Linux, Windows and Mac OS. The following command line in a terminal shell produces a video file in the mpeg format (in Windows)
ffmpeg -r 10 -i broken_stick_%02d.png -b:v 20M BrokenStick_video.mp4Copy
-r 10 controls the rate of frames per seconds (10 fps here) and -b:v 20M sets the bitrate in the output file.
The result is the following video
And voila! Done.
When it comes to rendering great animations either to understand the dynamic behind data or just to impress your manager and /or colleagues, R provides multiples options to do so. The best R-package for animations that I would recommend is animation which provides functions to save animations in Flash, GIF, HTML pages, PDFs and videos.
If you have enjoyed this post, please drop me some comments/suggestions.
P.S.: the background music is by Nas – The World Is Yours (Instrumental) produced by Pete Rock
