I got often asked (i.e. more than two times) by colleagues if they should plot/use the standard deviation or the standard error, here is a small post trying to clarify the meaning of these two metrics and when to use them with some R code example.
Standard deviation
Standard deviation is a measure of dispersion of the data from the mean.
#generate some random data
set.seed(20151204)
#compute the standard deviation
x<-rnorm(10)
sd(x)
1.144105
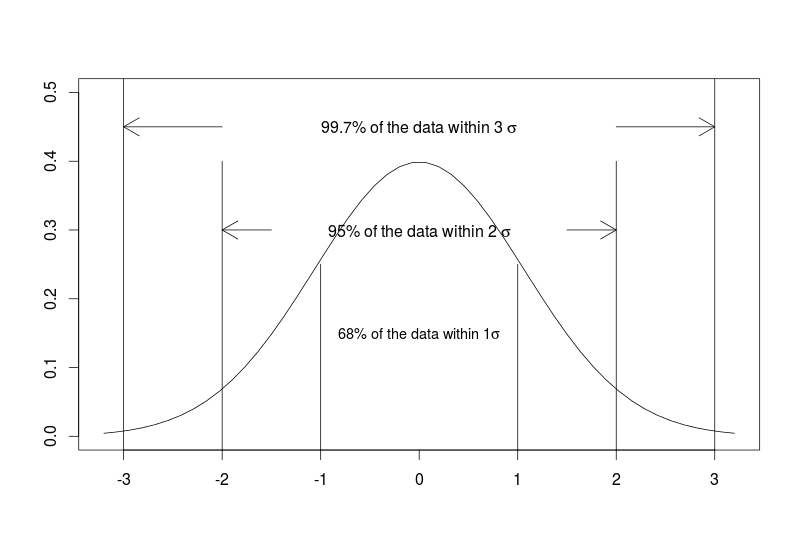
For normally distributed data the standard deviation has some extra information, namely the 68-95-99.7 rule which tells us the percentage of data lying within 1, 2 or 3 standard deviation from the mean.
plot(seq(-3.2,3.2,length=50),dnorm(seq(-3,3,length=50),0,1),type="l",xlab="",ylab="",ylim=c(0,0.5))
segments(x0 = c(-3,3),y0 = c(-1,-1),x1 = c(-3,3),y1=c(1,1))
text(x=0,y=0.45,labels = expression("99.7% of the data within 3" ~ sigma))
arrows(x0=c(-2,2),y0=c(0.45,0.45),x1=c(-3,3),y1=c(0.45,0.45))
segments(x0 = c(-2,2),y0 = c(-1,-1),x1 = c(-2,2),y1=c(0.4,0.4))
text(x=0,y=0.3,labels = expression("95% of the data within 2" ~ sigma))
arrows(x0=c(-1.5,1.5),y0=c(0.3,0.3),x1=c(-2,2),y1=c(0.3,0.3))
segments(x0 = c(-1,1),y0 = c(-1,-1),x1 = c(-1,1),y1=c(0.25,0.25))
text(x=0,y=0.15,labels = expression("68% of the data within 1" * sigma),cex=0.9)
Here is the plot we made:
Of course if the data are not normally distributed such interpretation is not valid. It remains that standard deviation can still be used as a measure of dispersion even for non-normally distributed data.
Standard error of the mean
It is a measure of how precise is our estimate of the mean.
#computation of the standard error of the mean
sem<-sd(x)/sqrt(length(x))
#95% confidence intervals of the mean
c(mean(x)-2*sem,mean(x)+2*sem)
-1.1337038  0.3134877
The main use of the standard error of the mean is to give confidence intervals around the estimated means where it follows the same 68-95-99.7 rule BUT this time not for the data itself but for the mean. This can also be extended to test (in terms of null hypothesis testing) differences between means. For example if the 95% confidence intervals around the estimated fish sizes under Treatment A do not cross the estimated mean fish size under Treatment B then fish sizes are significantly different from one another between the two Treatments. Note that the standard error of the mean depends on the sample size, the standard error of the mean shrink to 0 as sample size increases to infinity.
When to use standard deviation? When to use standard error?
It depends. If the message you want to carry is about the spread and variability of the data, then standard deviation is the metric to use. If you are interested in the precision of the means or in comparing and testing differences between means then standard error is your metric. Of course deriving confidence intervals around your data (using standard deviation) or the mean (using standard error) requires your data to be normally distributed. Bootstrapping is an option to derive confidence intervals in cases when you are doubting the normality of your data.
SE is never the metrics of choice. It’s a semi-product to calculate the CI. It’s interpretation is often no interest for the end user. It’s too short for comparisons (and I hope everyone now will do the math and check why), thus overused for cheating about the statistical significance on the graphs. Moreover, The resulting CI will depend also on the used distribution of the test statistics (e.g. SE*t_deg_fr), so SEs may be quite misleading to the readers. Even MORE, when the resulting CI is asymmetric with respect to the point estimate! It should be never assumed that the normal distribution should be used to calculate the CI. There’s often a need for a skewed distribution, e.g. for proportions, quantiles. SE will always be symmetric (just s/sqrt(n)), while the resulting CI does NOT have to. When I see SEs in a paper, I’m always suspicious about the results and – so far – only a few times it was “false alert”. Please don’t report it, calculate appropriate CI instead if you want to generalize the chosen measure (e.g. mean) to a population.
When calculating standard error the SD(x) is standard deviation of population or standard deviation of sample(where var^2/n-1) ?
You might want to add a simulation of what a standard error represents and explain that along with the equation. y <- replicate( 10000, mean(rnorm(10)) ); sd(y)