Machine learning is an important topic in lots of industries right now. It’s a fast moving field with lots of active research and receives huge amounts of media attention. This post isn’t intended to be an introduction to machine learning, or a comprehensive overview of the state of the art. Instead it will show how models built using machine learning can be leveraged from within Excel.
Why is this important? Companies are investing more and more into researching and developing prediction models using machine learning. Allowing access to these models in Excel opens up a whole range of possibilities.
PyXLL, the Python Excel Add-In embeds Python in Excel, allowing us to extend Excel with Python. Using this, we can add user defined functions, macros, menus and more with just Python code. We can take advantage of the entire Python ecosystem, which is perfect for bringing machine learning to Excel.
By the end of this post we’ll have built a model to classify animals in Excel, powered by Python!
All the source code for this post is available from the pyxll-examples github repo.
Python for Machine Learning
The Python programming language is well suited for machine learning. It has a huge array of well supported packages that make coding simpler and reduce development time. Machine learning, deep learning and artificial intelligence are extremely well catered for by several Python packages, therefore making Python an ideal choice.
Some popular machine learning packages for Python include:
scikit-learn
The scikit-learn package exposes a concise and consistent interface to the common machine learning algorithms, making it simple to bring ML into production systems. The library combines quality code and good documentation, ease of use and high performance and is de-facto industry standard for machine learning with Python.
The example code in this post will be using scikit-learn.
TensorFlow
TensorFlow was developed by Google. It is an open-source library of data flow graphs computations, which are optimised for Machine Learning. It was designed to meet the high-demand requirements of Google environment for training Neural Networks and is a successor of DistBelief, a Machine Learning system, based on Neural Networks. However, TensorFlow isn’t strictly for scientific use in border’s of Google - it is general enough to use it in a variety of real-world application.
The key feature of TensorFlow is their multi-layered nodes system that enables quick training of artificial neural networks on large datasets. This powers Google’s voice recognition and object identification from pictures.
Keras
Keras is an open source neural network library written in Python. It is capable of running on top of TensorFlow, Microsoft Cognitive Toolkit, or Theano. It was designed to enable fast experimentation with deep neural networks and focuses on being user-friendly, modular, and extensible.
From the documentation, use Keras if you need a deep learning library that:
- Allows for easy and fast prototyping (through user friendliness, modularity, and extensibility).
- Supports both convolutional networks and recurrent networks, as well as combinations of the two.
- Runs seamlessly on CPU and GPU.
PyTorch
PyTorch is a Python-based scientific computing package targeted at two sets of audiences:
- A replacement for NumPy to use the power of GPUs
- a deep learning research platform that provides maximum flexibility and speed
Decision Trees
Decision trees are a technique in machine learning used for classification and regression tasks. In this post we’ll be using a decision tree for a classification problem.
A decision tree works by splitting a set of training data into sub-sets based on features and a target feature. It does this based on multiple features, creating a tree of sub sets of the data. The leaf nodes contain the predictions used for new queries to the trained model. The following example will help us to understand how this works.
Suppose we had a data set of different animals with a number of different features for each animal, and with each animal classified as “mammal,” “bird”, “reptile”, “insect”, “mollusc” and “amphibian”. Given the same attributes for an animal not in our original training data, how can we predict what class of animal it is?
Intuitively we might split the data as follows:
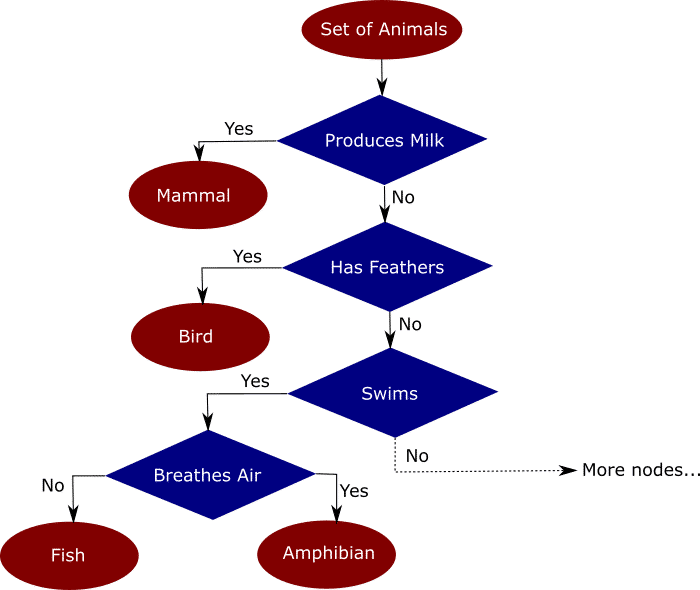
Splitting the data into a tree based on the features available makes it easy to classify new input data points. How accurately the tree classifies new data points depends on how well the decisions in the tree reflect reality.
In this example the (incomplete) tree I used my intuition and knowledge of animals to build the decision tree. What machine learning does for us is to figure out how to split the data based on the features in the training set automatically. This is what we mean when we talk about training a model. Being able to do this is very powerful. An algorithm can analyze far more data in a shorter amount of time than would ever be possible by hand.
There’s a lot more to how decision trees work and in particular the mathematics of how they can be constructed. We won’t go into this in any more detail in this post, but in the next section we’ll build an example model and show how it can be used from Excel.
Training an Example Model
Carrying on from the above section, we’ll train a model to classify animals using a decision tree. We’ll use the UCI Zoo Data Set, containing 101 animals with 17 boolean features and the class attribute we want as our target.
We’ll be using pandas to load the data, and scikit-learn to build the decision tree.
To start with we load the data into a pandas DataFrame, split it into the features and the target (animal class) that we want to train for. We then split the data again into a training set and a test set. SciKit-Learn uses the training set to train the model, and we reserve the test set to gauge the accuracy of the model.
from sklearn.tree import DecisionTreeClassifier
from sklearn.model_selection import train_test_split
import pandas as pd

# Read the input csv file
dataset = pd.read_csv("zoo.csv")

# Drop the animal names since this is not a good feature to split the data on
dataset = dataset.drop("animal_name", axis=1)

# Split the data into features and target
features = dataset.drop("class", axis=1)
targets = dataset["class"]

# Split the data into a training and a testing set
train_features, test_features, train_targets, test_targets = \
        train_test_split(features, targets, train_size=0.75)
Now comes the clever bit! Using scikit-learn’s DecisionTreeClassifer we can train the decision tree using our training data. For real-world work there are several tuning parameters that we might use to avoid over-fitting. Here we set a max depth of 5 for the tree. You can play around with this value and see how it affects the results.
# Train the model
tree = DecisionTreeClassifier(criterion="entropy", max_depth=5)
tree = tree.fit(train_features, train_targets)
Those two lines of code have built and trained our decision tree! To test how accurately it can make predictions we use the portion of the training data that we didn’t use to train the model.
# Predict the classes of new, unseen data
prediction = tree.predict(test_features)

# Check the accuracy
score = tree.score(test_features, test_targets)
print("The prediction accuracy is: {:0.2f}%".format(score * 100))
We can use this decision tree to make predictions based on new input data.
# Try predicting based on some features
features = {
    "hair": 0,
    "feathers": 1,
    "eggs": 1,
    "milk": 0,
    "airbone": 1,
    "aquatic": 0,
    "predator": 0,
    "toothed": 1,
    "backbone": 1,
    "breathes": 1,
    "venomous": 0,
    "fins": 0,
    "legs": 1,
    "tail": 1,
    "domestic": 0,
    "catsize": 0
}

features = pd.DataFrame([features], columns=train_features.columns)
prediction = tree.predict(features)[0]
print("Best guess is {}".format(prediction])
Calling the Model from Excel
Once we’ve done the hard work of building and testing a model we need to put it to some use! Excel is a great front-end tool for playing with data interactively. It’s used virtually everywhere and so being able to deliver your model in Excel to non-developer users massively opens up opportunities for how it can be used in your business. Even if the model is being used as part of a real-time or batch system, being able to call the model interactively can be really helpful when trying to understand the behaviour of a system.
Fortunately now the model is written in Python getting it into Excel is extremely simple. PyXLL, the Python Excel Add-In has everything we need to write Python for Excel. All we need to do is add a few @xl_func decorators from the pyxll module and configure the PyXLL add-in to load the module containing our model.
If you’re not already familiar with PyXLL, check out the introduction to PyXLL from the user guide.
Construct the decision tree
We start with a function to get the decision tree. The user will call this to get the decision tree object, and then pass that result into subsequent functions to make predictions. Here we will construct it again, but for more complex examples we could train the model offline and save the trained model (using “pickle” for example) and then load that instead of recreating it. Creating the model in Excel gives us the possibility to play with some of the training parameters, which is fun.
from pyxll import xl_func
from sklearn.tree import DecisionTreeClassifier
from sklearn.model_selection import train_test_split
import pandas as pd
import os

@xl_func("float, int, int: object")
def ml_get_zoo_tree(train_size=0.75, max_depth=5, random_state=245245):
    # Load the zoo data
    dataset = pd.read_csv(os.path.join(os.path.dirname(__file__), "zoo.csv"))

    # Drop the animal names since this is not a good feature to split the data on
    dataset = dataset.drop("animal_name", axis=1)

    # Split the data into a training and a testing set
    features = dataset.drop("class", axis=1)
    targets = dataset["class"]

    train_features, test_features, train_targets, test_targets = \
        train_test_split(features, targets, train_size=train_size, random_state=random_state)

    # Train the model
    tree = DecisionTreeClassifier(criterion="entropy", max_depth=max_depth)
    tree = tree.fit(train_features, train_targets)

    # Add the feature names to the tree for use in predict function
    tree._feature_names = features.columns

    return tree
The code above is the same as the code we saw previously for training the decision tree, except for the @xl_func decorator. That is what tells the PyXLL add-in that we want that function exposed to Excel as a user defined function. The string “float, int, int: object” is the function signature. This is optional, but without it the user could pass different types (strings etc) to the function and it might fail. The return type “object” means that the “DecisionTreeClassifier” object will be returned to Excel as a Python object without trying to convert it to anything else – the function returns a handle that can be passed to other Python functions.
This code should be added to a new module and added to the modules list in the pyxll.cfg config file. You will also need to install the PyXLL add-in if you’ve not done so already.
All the arguments to the function are optional as they have default values, but if we wanted to it would let us play around with inputs to the training of the decision tree.
Use the model to make predictions
Now all we need to be able to use the model is another function to pass inputs and get a prediction. For this we use the same code as before, broken out into another function with the “@xl_func” decorator.
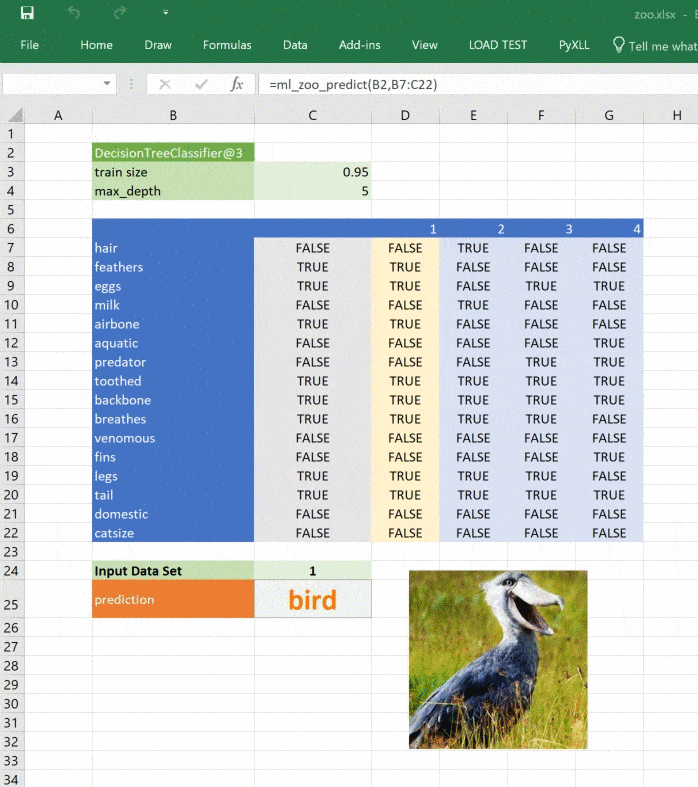
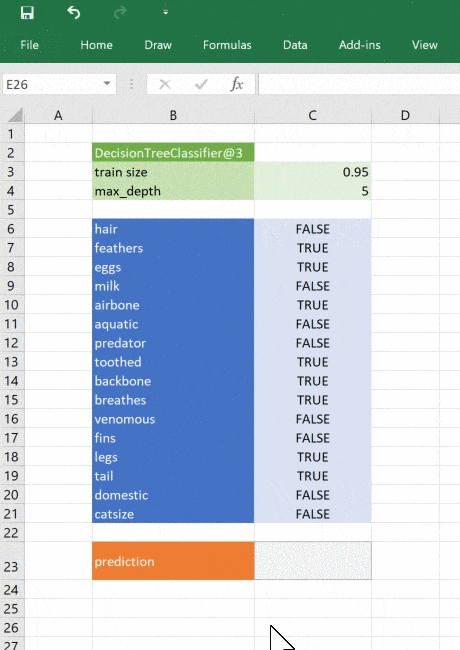
_zoo_classifications = {
    1: "mammal",
    2: "bird",
    3: "reptile",
    4: "fish",
    5: "amphibian",
    6: "insect",
    7: "mollusc"
}

@xl_func("object tree, dict features: var")
def ml_zoo_predict(tree, features):
    # Convert the features dictionary into a DataFrame with a single row
    features = pd.DataFrame([features], columns=tree._feature_names)
    # Get the prediction from the model
    prediction = tree.predict(features)[0]
    return _zoo_classifications[prediction]
The model returns an integer for the predicted classification. The “_zoo_classifications” dictionary gives us the human readable name from the number.
This function takes the decision tree object returned by the “ml_get_zoo_tree” function and a list of key, value pairs that are passed to our Python function as a dictionary. It matches the feature names used when constructing the tree to the input features so that they are ordered correctly when calling “tree.predict”.
Our decision tree is a simple example, trained with minimal data. The same principle applies to any type of sophisticated model applicable to your business. Using Python you can research, develop and train models to give valuable insights and make fast predictions based on real data. You can then deliver those models to Excel users without them needing to have any programming experience or expertise in advanced statistics. It would even be possible to build tools to develop and train models entirely in Excel (e.g. building graphs with TensorFlow), if you wanted to!
Bonus: Making it Fun
Of course everyone enjoys black and white spreadsheets of numbers, but sometime I like to add little bits here and there to make spreadsheets more engaging 🙂
PyXLL allows us to access the Excel Object Model with its “xl_app” function. The Excel Object Model is exactly the same as what you use in VBA. The following function creates a Picture object in our sheet and loads an image depicting the predicted classification.
from pyxll import xl_app

def show_image_in_excel(classification, figname="prediction_image"):
    """Plot a figure in Excel"""
    # Show the figure in Excel as a Picture object on the same sheet
    # the function is being called from.
    xl = xl_app()
    sheet = xl.ActiveSheet

    # if a picture with the same figname already exists then get the position
    # and size from the old picture and delete it.
    for old_picture in sheet.Pictures():
        if old_picture.Name == figname:
            height = old_picture.Height
            width = old_picture.Width
            top = old_picture.Top
            left = old_picture.Left
            old_picture.Delete()
            break
    else:
        # otherwise create a new image
        top_left = sheet.Cells(1, 1)
        top = top_left.Top
        left = top_left.Left
        width, height = 100, 100

    # insert the picture
    filename = os.path.join(os.path.dirname(__file__), "images", _zoo_classifications[classification] + ".jpg")
    picture = sheet.Shapes.AddPicture(Filename=filename,
                                      LinkToFile=0,  # msoFalse
                                      SaveWithDocument=-1,  # msoTrue
                                      Left=left,
                                      Top=top,
                                      Width=width,
                                      Height=height)

    # set the name of the new picture so we can find it next time
    picture.Name = figname
Calling this function from “ml_zoo_predict” updates the picture in Excel each time the prediction changes. Because the function updates Excel we need to call it after Excel has finished calculating. The pyxll function “async_call” does exactly that. Here’s the updated “ml_zoo_predict” function:
from pyxll import xl_func, async_call

@xl_func("object tree, dict features: var")
def ml_zoo_predict(tree, features):
    # Convert the features dictionary into a DataFrame with a single row
    features = pd.DataFrame([features], columns=tree._feature_names)

    # Get the prediction from the model
    prediction = tree.predict(features)[0]

    # Update the image in Excel
    async_call(show_image_in_excel, prediction)

    return _zoo_classifications[prediction]
The image in our spreadsheet updates whenever the prediction changes.