https://www.patreon.com/PredictiveInsightsAI
Objective: Create a method which easily combines loss runs, or listings of insurance claims, into triangles. Using only Excel, the common method is to create links between the excel files which must be updated manually at each new evaluation. This is prone to human error and is time-consuming. Using a script to merge the files first and then create a triangle saves time and is more consistent.
Example of the conventional linked Excel triangle:
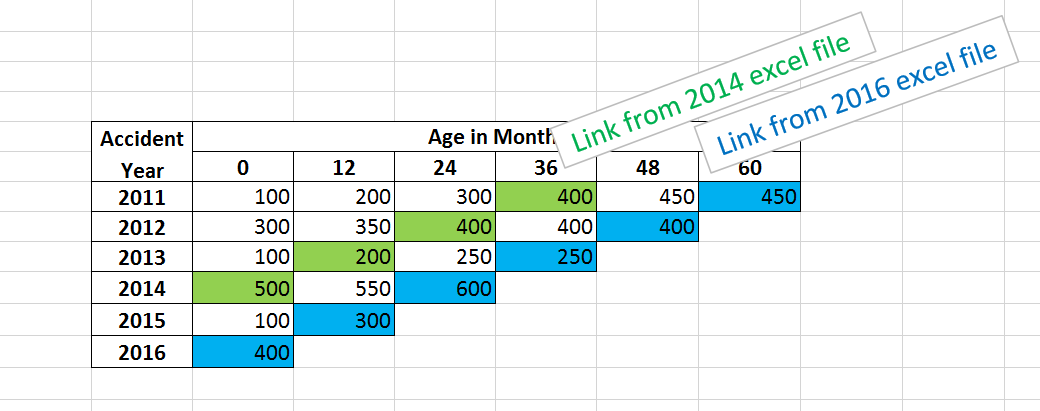
For accident year 2016, all the diagonal values need to be linked to a data file that was last evaluated in 2016. For 2015, the links go to the 2015 file, for 2014, the 2014 file, ect. This is time consuming, and gets even more complicated if there are multiple files for each evaluation year.
See Wikipedia for a definition of Loss Development Triangles and why they are useful.
Methods
To locate the current working directory, I use the package here. To read in the Excel files and manipulate the data, I use readxl, dplyr, and plyr. The package ChainLadder has a variety of tools for actuarial reserve analysis.
library(here)
library(plyr)
library(readxl)
library(lubridate)
library(dplyr)
library(ChainLadder)
Step 1: Organize the Excel Files
We will loop through all of the excel files and extract the data needed.
Copy all of the Excel claims listing files into a folder named “excel files”, inside the working directory of the R project. It is important to have *only* the files that are going to be loaded into R in this folder. We will tell R where these files are by creating a file path. The function here() automatically takes in the current R working directory.
wd_path = paste(here::here(), "/excel files", sep = "")
Using the command list.files(), R automatically looks in the working directory and returns a vector of all the the file names which it sees. For example, R sees the claims list files.
list.files(wd_path)
"claims listing 1.xlsx"
"claims listing 2.xlsx"
"claims listing 3.xlsx"
"claims listing 4.xlsx"
"claims listing 5.xlsx"
"claims listing 6.xlsx"
R can then loop through each of these files and perform any action. If there were 100 files, or 1000 files in this directory, this would still work.
The loss files have dummy data for a claims listing. Each row is an individual claim which would have a member name, memberID, loss date, report date, paid loss amount, incurred loss amount, case reserve amount, etc. To make this as realistic as possible, they have arbitrary columns in addition to the ones which we need, file_year, accident_year, and paid.
file_names = list.files(wd_path)
file_paths = paste(wd_path, "/", file_names, sep = "")
head(read_excel(file_paths[3]), 4)
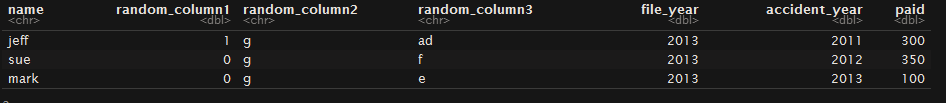
In order to evaluate the age of the losses, we need to take into account when each loss was evaluated. This is accomplished by going into Excel and adding in a column for “file_year”, which specifies the year of evaluation of the file. For instance, for the “claim listing 2013” file, all of the claims have a “2013” in the “file_year” column.
Step 2: Load the Data into R
We will combine all of the excel files with a simple function.
Initialize a data frame which will store the aggregated loss run data from each of the excel files. **The names of this data frame need to be the names of excel file columns which need to be aggregated.** For instance, these could be “reported”, “Paid Loss”, “Case Reserves”, or “Incurred Loss”. If the excel files have different names for the same quantities (ie, “Paid Loss” vs. “paid loss”), then they should be renamed within excel first.
Choose which columns are needed from the files.
columns_needed = c("file_year", "accident_year", "paid")
Create a temporary “storage” data frame.
merged_data = as_data_frame(matrix(nrow = 0, ncol = length(columns_needed)))
names(merged_data) = columns_needed
Someone once said “if you need to use a ‘for’ loop in R, then you are doing something wrong”. Vectorized functions are faster and easier to implement. The function `extract_needed_excel_data` below takes in the file name of the excel file and returns a data frame with only the columns which are selected.
extract_needed_excel_data = function(cur_file_path){
  read_excel(cur_file_path) %>%
    select(columns_needed) %>%
    rbind(merged_data)
}
Apply the function to all of the files in the folder that you created. Obviously, if you had 100 excel files this would still work just as effectively.
From the plyr package, ldply takes in a list and returns a data frame. The way to remember this is by the ordering of the letters (“list”-“data frame”-“ply”). For example, if we wanted to read in a data frame and return a data frame, it would be ddply.
loss_run_data = ldply(file_paths, extract_needed_excel_data)
The data now has only the columns what we selected, despite the fact that the loss run files had different columns in each of the files.
head(loss_run_data)
## file_year loss_year paid
    ## 2011    2011   100
    ## 2012    2011   200
    ## 2012    2012   300
    ## 2013    2011   300
    ## 2013    2012   350
    ## 2013    2013   100
Step 3: Create Development Triangles
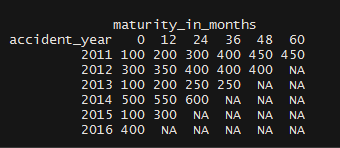
Finally, once we have the loss run combined, we just need to create a triangle. This is made easy by the as.triangle function from the ChainLadder package.
The only manual labor required in excel was to go into each file and create the file year column, which was just the year of evaluation of each loss run file.
loss_run_data  = loss_run_data %>%
  mutate(maturity_in_months = (file_year - accident_year)*12)

merged_triangle = as.triangle(loss_run_data,
                              dev = "maturity_in_months",
                              origin = "accident_year",
                              value = "paid")

merged_triangle
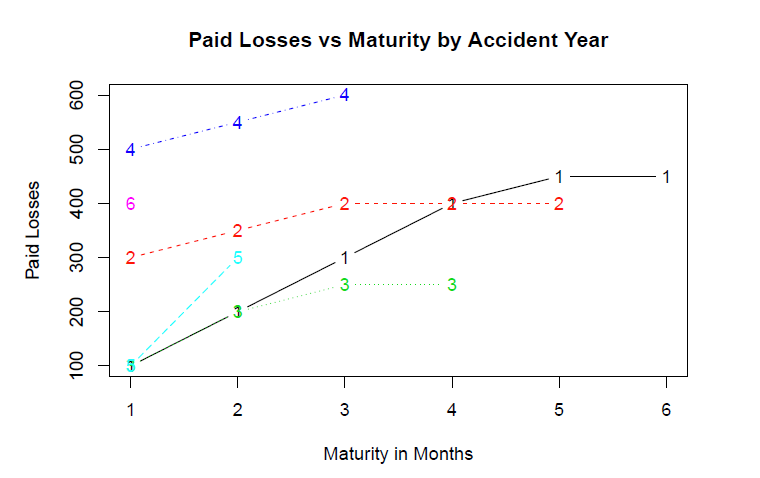
If we wanted to, we could now easily examine other variables such as claim counts, calculate LDFs, or create visualizations. Within the package ChainLadder is a plot function, which shows the development of losses by accident year. Because these are arbitrary amounts, the plot is not realistic.
plot(merged_triangle,
     main = "Paid Losses vs Maturity by Accident Year",
     xlab = "Maturity in Months",
     ylab = "Paid Losses")
Summary
When it comes to aggregating excel files, R can be faster and more consistent than linking together each of the excel files, and once this script is set in place, making modifications to the data can be done easily by editing the exel_file_extractor function. The only manual labor required in excel was to go into each file and create the file_year column, which was just the year of evaluation of each loss run file.
Download the data and Rmd files for this article from my github account
Quick suggestion for more portable file system instructions: you might want to use the here package: (described nicely in this post by Jenny Bryan https://www.tidyverse.org/articles/2017/12/workflow-vs-script/#use-projects-and-the-here-package-https-cran-r-project-org-package-here)!
This looks very helpful. Thanks!