Patterns tend to repeat themselves. Well… if someone starts to learn about the technical analysis of price action for any asset, this quote will be something that would be repeated a lot. That’s why I deiced to put this claim to a test.
In this post, I’ll try to read the price data of a cryptocurrency into R. Split that into smaller segments (mostly containing a specific pattern) and try to see if this pattern has happened before in its history or not. If you put this idea into a more technical term, what I’m dealing with is basically a clustering problem. In clustering problem usually, we need to deal with two different things: first finding a measure of similarity/dissimilarity and finding a suitable clustering algorithm. In short, what I’m planning to do in this post is to use Dynamic Time Wraping (DTW) as my measure of similarity and to use dtwclust package with ‘partitional’ algorithm for my clustering.
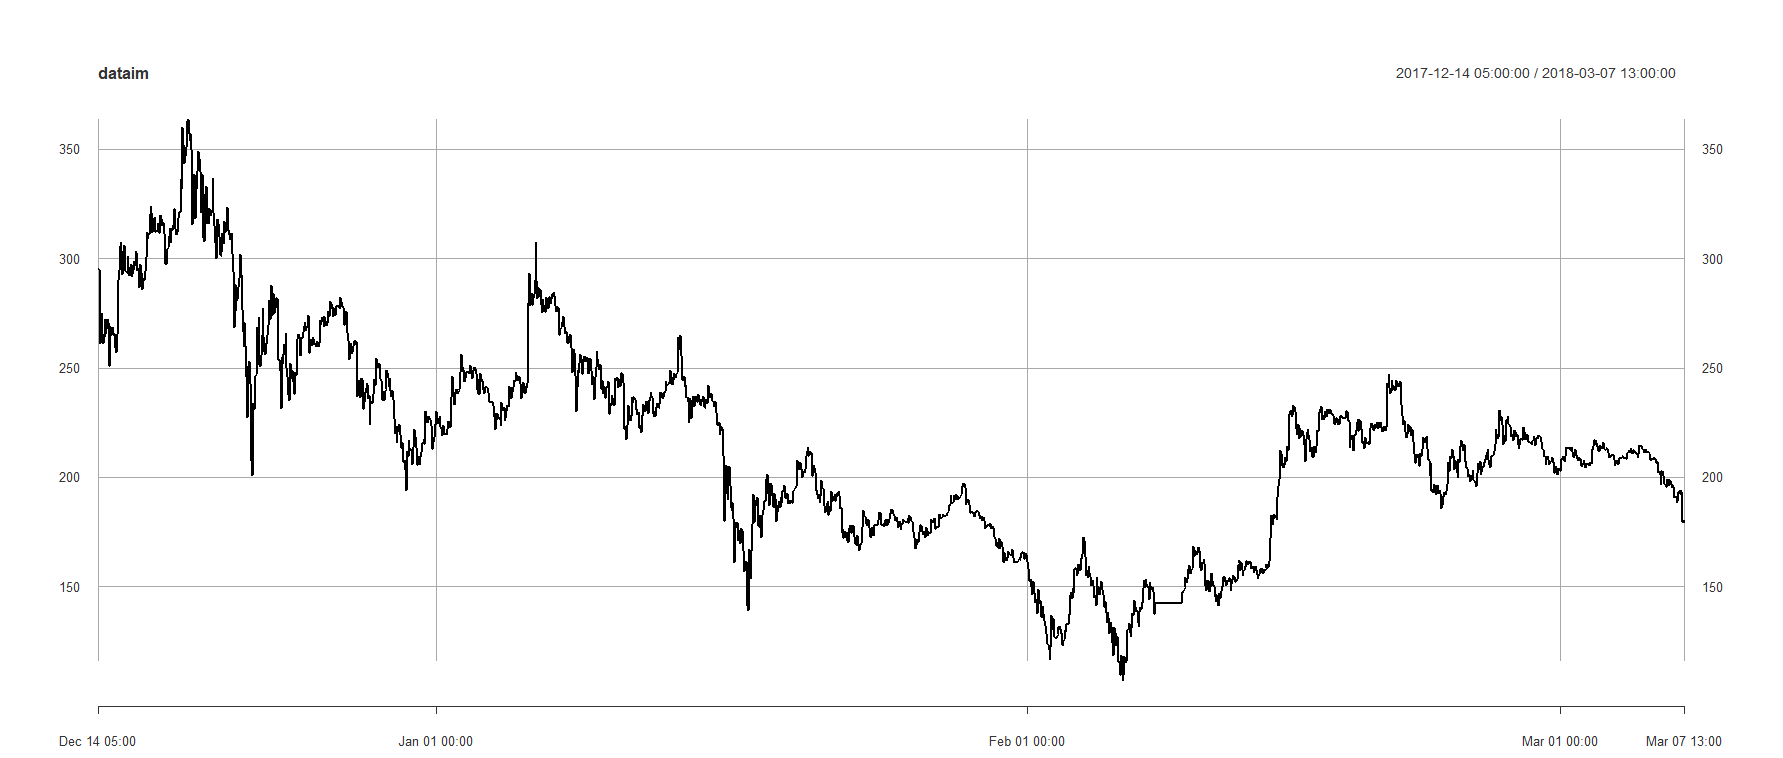
First of all, I will be using the API of cryprocompare.com to access to the data and read them in. I chose to read the prices of LTC from binance exchange which you can modify that to your coin of interest.
#Reading data in and converting time and keeping just the close price
(fromJSON(paste0("https://min-api.cryptocompare.com/data/histohour?fsym=LTC&tsym=USDT&limit=2000&aggregate=1&e=Binance"))$Data)%>%
  mutate(time=as.POSIXct(time, origin="1970-01-01"))%>%
  select(time,close)->Priced
# Creating xts object
dataim<-xts(Priced[,2],order.by=Priced$time)
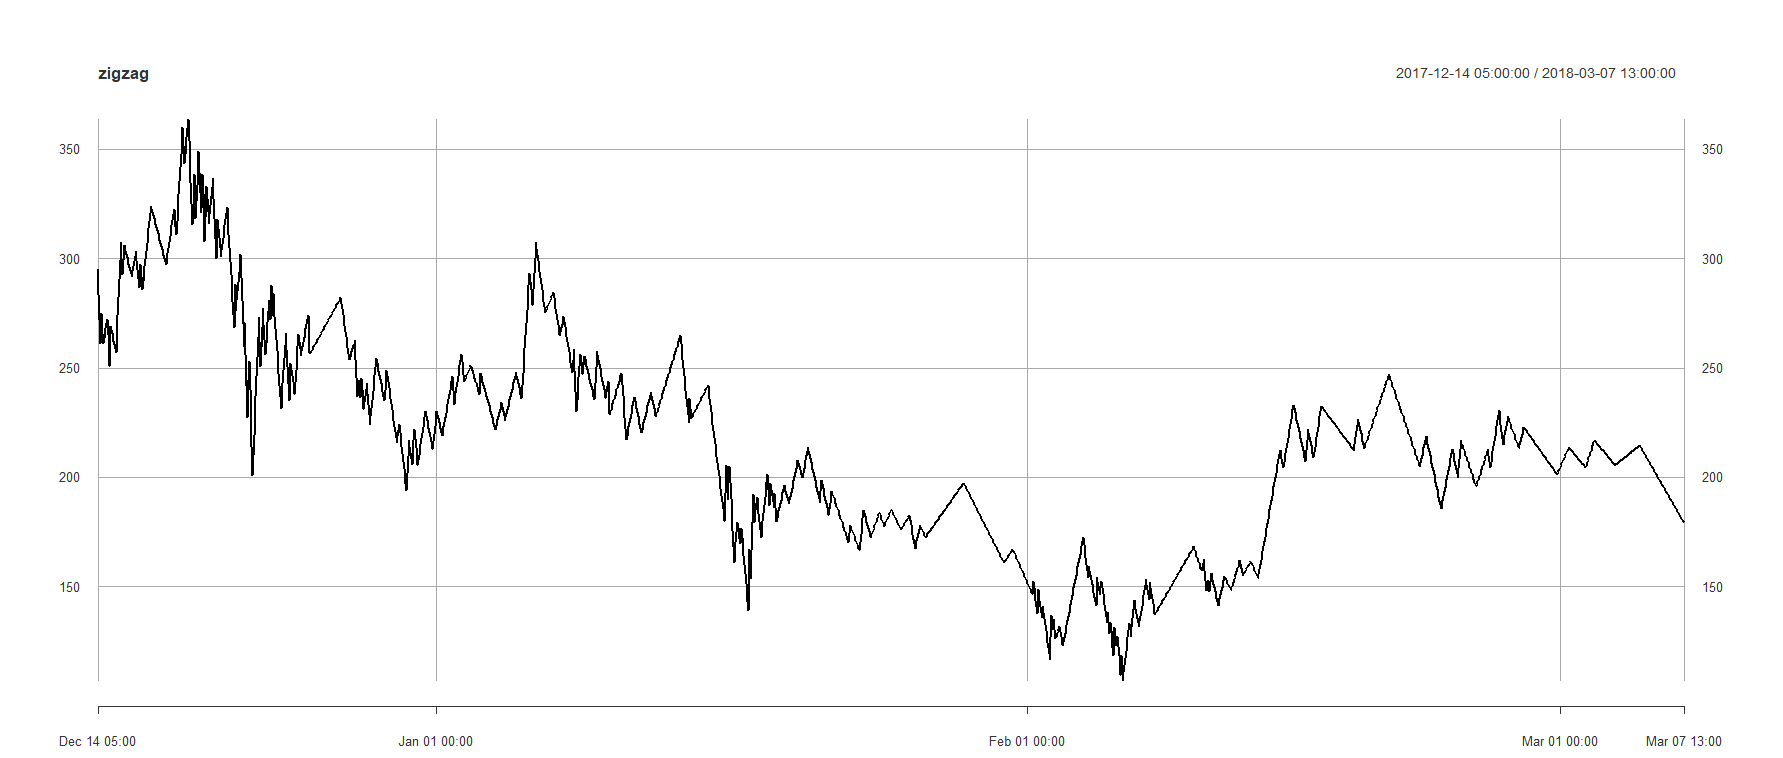
In the next step, before using the raw data for my analysis, I will be performing a ZigZag on my raw prices and removing the changes below some threshold (I chose 3% here.). This allows us to focus on the main actions and patterns in the price.
ZigZag(dataim,change = 3)->zigzag
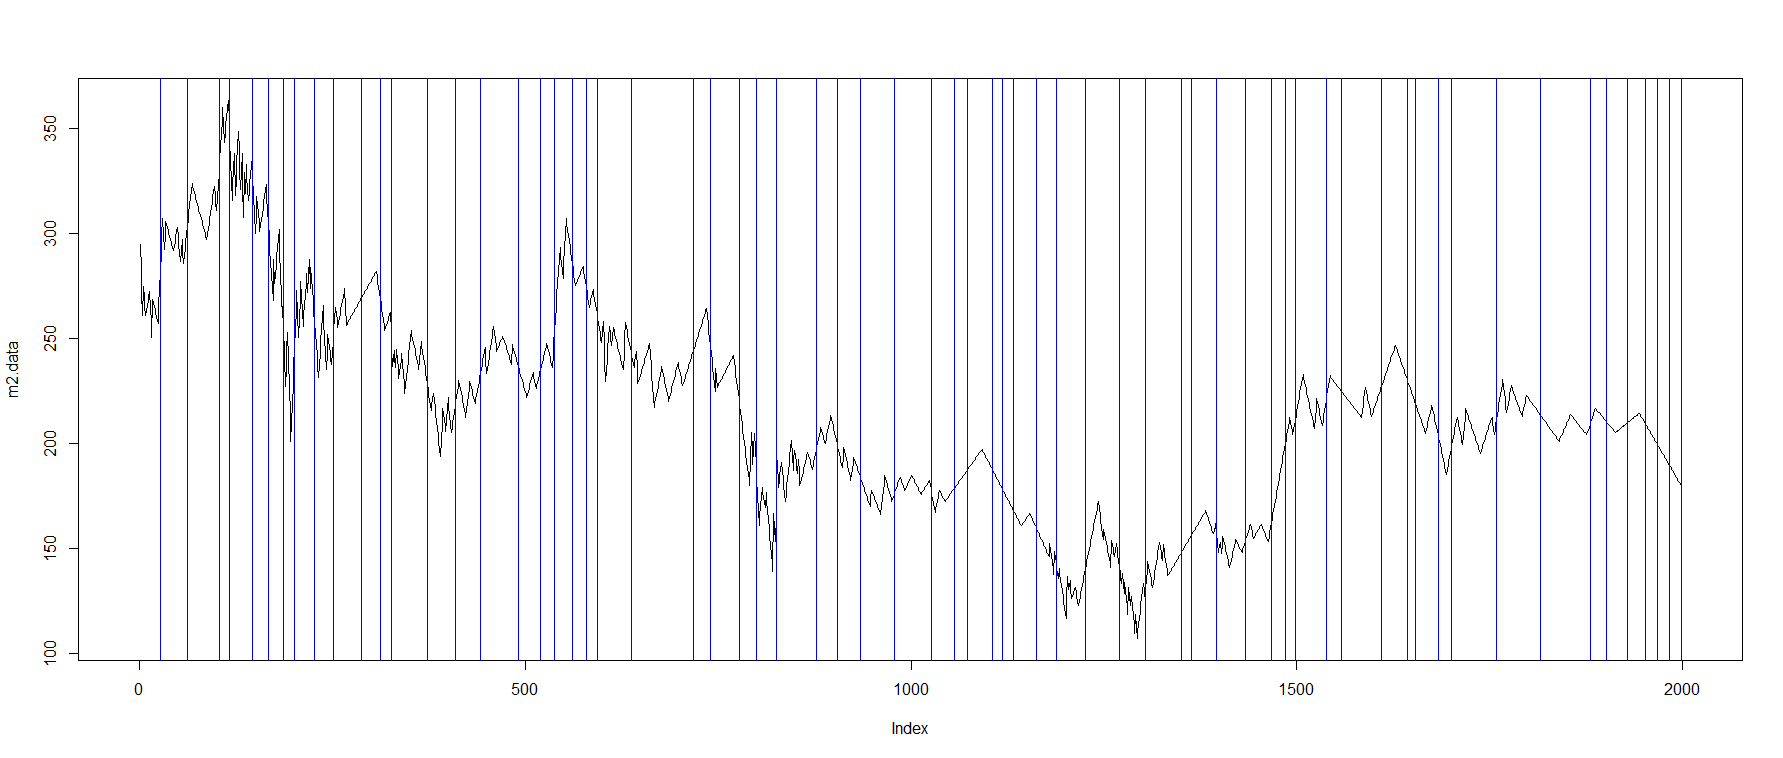
At this point, we need to find a way to break down the whole time series into smaller pieces which each piece would represent a pattern. There many different ways to accomplish this such as using a sliding window. However, sliding window may fail to find the starting points of the patterns or it may combine multiple patterns into one. So instead, I decided to use changepoint package which calculates the optimal positioning of multiple change points using PELT algorithm. This package offers several other algorithms and I admit that this part might be the bottle neck of the whole idea.
m2.data<-as.numeric(zigzag)[1:1998]
m2.pelt <- cpt.meanvar(m2.data, method = "PELT",penalty = "MBIC")
plot(m2.data,type='l')
abline(v=m2.pelt@cpts,col="blue")
cpts(m2.pelt)
timesplits<-map2(c(1,cpts(m2.pelt)),c(cpts(m2.pelt),length(m2.data)), function(x,y) m2.data[seq(x,y)])
timesplits <- reinterpolate(timesplits, new.length = max(lengths(timesplits)))
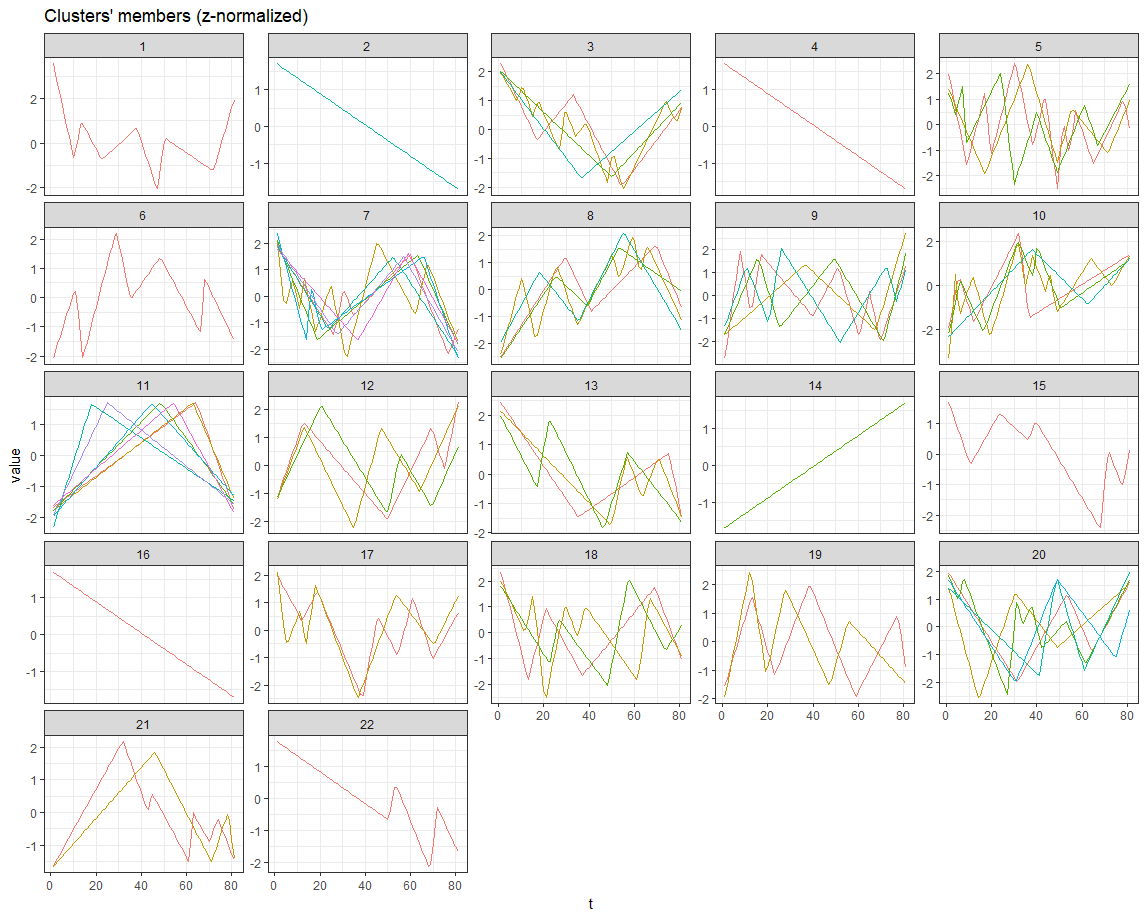
Finally, tsclust was used to cluster different segments found in the previous part and see if any of those patterns have been repeated before. Well…, one point that needs to be kept in mind is that the patterns will never look exactly alike, however, they would share similar behaviors and ups and downs.
Actually, the main reason we chose the DTW as our similarity measure was the fact that DTW allows to find patterns that no only they look alike but also it picks up similar patterns with different speeds in time (Patterns that they are similar but one is stretched or squeezed in time).
hc <- tsclust(timesplits, type = "partitional", k = length(timesplits)/3,
              distance = "dtw2", trace = TRUE, centroid = "shape")
#plot(hc)
plot(hc,type="series")
Gives this plot:
How to improve this? I believe that there are multiple things that need to be kept in mind:
- First, as I mentioned before, we need to be able to find an optimal way that would help us break the patterns apart.
- Secondly, more options need to investigated for defining the distance measure/centriod and the number of desired clusters.
You can also find the full code on my github
Hope you liked this post.