Before we build stats/machine learning models, it is a good practice to understand which predictors are significant and have an impact on the response variable.
In this post, we deal with a particular case when both your response and predictor are categorical variables.
By the end of this, you’d have gained an understanding of what predictive modeling is and what the significance and purpose of chi-square statistic is. We will go through a hypothetical case study to understand the math behind it. We will actually implement a chi-squared test in R and learn to interpret the results. Finally, you’ll be solving a mini challenge before we discuss the answers.
- Background Knowledge
- Case Study – Effectiveness of a drug treatment
- Purpose and math behind Chi-Sq statistic
- Chi-Sq Test
- R Code
- Mini-Challenge
Background knowledge – Predictive modelling
For the sake of completeness, let’s begin by understanding how predictive modelling works so you can better appreciate the significance of chi-squared tests and how it fits in the process.
Predictive modelling is a technique where we use statistical modelling or machine learning algorithms to predict a response variable/s based on one or more predictors.
The predictors are typically features that influence the response in some way. The models work best if the features are meaningful and have a significant relationship with the response.
But, you normally wouldn’t know beforehand if the response is dependent on a given feature or not. We can use the chi-squared test to determine if they are dependent or not, provided, both response and predictors are categorical variables.
Hypothetical Example: Effectiveness of a Drug Treatment
Let’s consider a hypothetical case where we test the effectiveness of a drug for a certain medical condition.
Suppose we have 105 patients under study and 50 of them were treated with the drug. The remaining 55 patients were kept as control samples. The health condition of all patients was checked after a week.
The following table shows if their condition improved or not. Just by looking at it, can you tell if the drug had a positive effect on the patients.
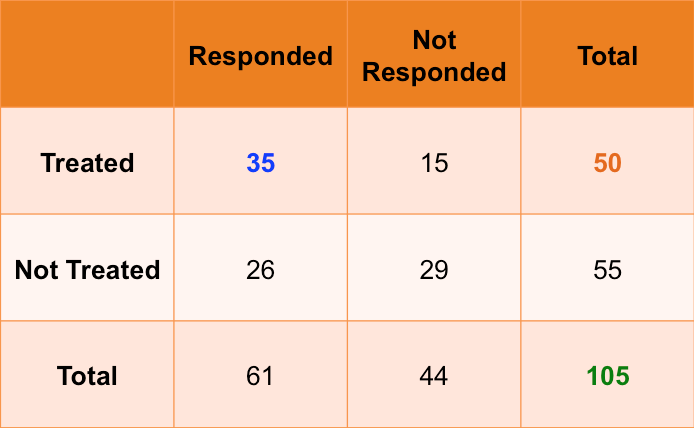
As you can see, 35 out of the 50 patients showed improvement. Suppose if the drug had no effect, the 50 would have been split the the same proportion as the patients who were not given the treatment. But in this case, about 70% of patients showed improvement, which is significantly higher than the control case.
Since both categorical variables have only 2 levels, it was sort of intuitive to say that the drug treatment and health condition are dependent. But, as the number of categories increase, we need a quantifiable statistic to definitively say if they are dependent or not.
One such a metric is the chi-squared statistic.
Chi-Squared Statistic
For sake of understanding, lets see how Chi-squared statistic is computed for the 2 by 2 case.
To begin with, we will assume that the 2 variables are not related to each other. If that is the case, can you tell what would the expected value of each cell? For example, the first cell will take the value: 50 times 61 by 105, which equals 29.04.
All the expected values can be computed this way (shown in brackets).
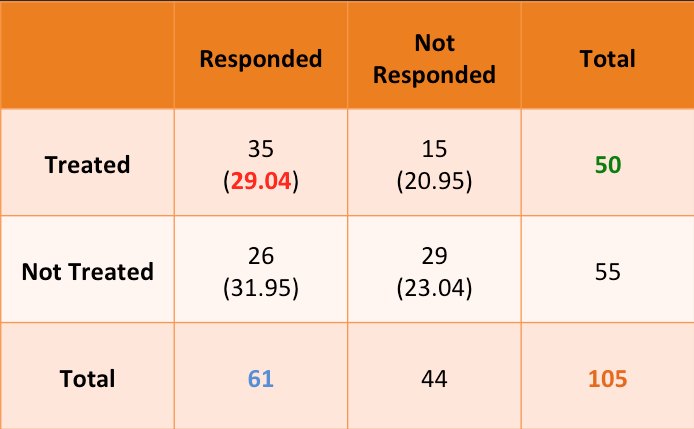
Once that is done, the Chi-Sq statistic is computed as follows.
$$\chi^2= \sum_{i=1}^{n} \frac{(O_i – E_i)^2}{E_i}$$
Numeric Computation
\(\ Chi-Sq = ((35-29.04)^2 / 29.04) + ((15-20.95)^2 / 20.95) + \)
\(\ ((26-31.95)^2 / 31.95) + ((29-23.04)^2/23.04) = 5.56 \)
This value will be larger if the difference between the actual and expected values widens.
Also, the more the categories in the variables the larger the chi-squared statistic should be.
Chi-Squared Test
In order to establish that 2 categorical variables are dependent, the chi-squared statistic should be above a certain cutoff. This cutoff increases as the number of classes within the variable increases.
Alternatively, you can just perform a chi-squared test and check the p-values.
Like all statistical tests, chi-squared test assumes a null hypothesis and an alternate hypothesis. The general practice is, if the p-value that comes out in the result is less than a pre-determined significance level, which is 0.05 usually, then we reject the null hypothesis.
H0: The The two variables are independent
H1: The two variables are related.
The null hypothesis of the chi-squared test is that the two variables are independent and the alternate hypothesis is that they are related.
R Code
Let’s work it out in R by doing a chi-squared test on the treatment (X) and improvement (Y) columns in treatment.csv
First, read in the treatment.csv data.
df <- read.csv("https://goo.gl/j6lRXD")
table(df$treatment, df$improvement)
              improved not-improved
  not-treated       26           29
  treated           35           15
Let’s do the chi-squared test using the chisq.test() function. It takes the two vectors as the input. We also set `correct=FALSE` to turn off Yates’ continuity correction.
# Chi-sq test
chisq.test(df$treatment, df$improvement, correct=FALSE)
	Pearson's Chi-squared test

data:  df$treatment and df$improvement
X-squared = 5.5569, df = 1, p-value = 0.01841
We have a chi-squared value of 5.55. Since we get a p-Value less than the significance level of 0.05, we reject the null hypothesis and conclude that the two variables are in fact dependent. Sweet!
Mini-Challenge
For this challenge, find out if the ‘cyl’ and ‘carb’ variables in ‘mtcars’ dataset are dependent or not. Go ahead, pause and try it out. I will be showing the answers in a few seconds. Good Luck!
So here is my answer:
Let’s have a look the table of mtcars$carb vs mtcars$cyl.
table(mtcars$carb, mtcars$cyl)
    4 6 8
  1 5 2 0
  2 6 0 4
  3 0 0 3
  4 0 4 6
  6 0 1 0
  8 0 0 1
Since there are more levels, it’s much harder to make out if they are related. Let’s use the chi-squared test instead.
# Chi-sq test
chisq.test(mtcars$carb, mtcars$cyl)
	Pearson's Chi-squared test

data:  mtcars$carb and mtcars$cyl
X-squared = 24.389, df = 10, p-value = 0.006632
We have a high chi-squared value and a p-value of less that 0.05 significance level. So we reject the null hypothesis and conclude that carb and cyl have a significant relationship.
Congratulations if you got it right!
Nice, tutorial Sir, I have a doubt getting P value less than 0.05 only we reject Null Hypothesis and can say that both are related to each other and if P value is more than 0.05 then they are not related to each other. Is it right ? and for what type of applications we use this chi-square test?
Thank you for the post. Can you explain to me how to calculate degrees of freedom for a 1×2 chi-squared test? My understanding is that DF for chi-squared is nrows-1 * ncols-1, which with a 1×2 chi-squared test gives you 0 * 1, which gives you 0 degrees of freedom, and that doesn’t sound right…
Actually it is number of categories – 1, and not nrows-1.
DF = (n – 1) * (m – 1) where n and m are the number of levels in the 2 categorical variables.
So, in this case it is: (2-1)*(2-1) = 1
I think Kevin was asking about a different, hypothetical situation, where there was not a 2×2 table, but a 1×2.
A 2×2 chi-squared test means there are 2 levels in both categorical variables provided as input to chisq.test()
A 1×2 chi-square test would be meaningless, because there would be only 1 level in one of the categorical variables. In other words, all the values in that variable in the same, which is not of any use.
Thank you, Brian and Selva.
A 1 x 2 goodness of chi-squared with 1 df is possible where you have a priori expectations about frequencies but not for testing association between variables.
An example is in the ratio of tall:small pea plants from a heterozygous cross (Tt x Tt) in which, a priori expectations ( according to mendel’s law) are frequencies in a ratio of 3:1