In any model development exercise, a considerable amount of time is spent in understanding the underlying data, visualizing relationships and validating preliminary hypothesis (broadly categorized as Exploratory data Analysis). A key element of EDA involves visually analyzing the data to glean valuable insights and understand underlying relationships & patterns in the data.
While EDA is defined more as a philosophy rather than a defined set of procedures and techniques, there is a certain set of standard analysis that you would most likely perform as part of EDA to gain an initial understanding of the data.
This post provides an overview of a package RtutoR that I had developed some time back and have recently added a few new functionalities to automate some elements of EDA. In nutshell, the functionalities provided in the package would help you:
- Automatically generate common univariate and bivariate plots and summary tables by invoking a function
-
An output report is generated as a PowerPoint deck (using the
ReporterRspackage) containing all the plots and summary tables generated by invoking the function - Finally, a Shiny App version of the function is provided as well that provides an interactive version of the resulting plots (If you want to see a quick demo of the Shiny app, you can view it here)
Example
To understand the package functionalities, let’s look at a simple example. We will consider the Titanic dataset for this example (Most of you should be familiar with this dataset. This is a commonly used practice problem in Kaggle and the dataset can be downloaded from here). The problem statement is to predict the likelihood of a passenger surviving the Titanic disaster given a set of attributes such as Passenger Age, Gender, Fare price etc.
Before we proceed with building a model, we first try to gain a better understanding of the underlying data. This would generally include analysis such as :
- Univariate Analysis: Understand data distribution & summary analysis of individual features in our dataset. For e.g. we may plot histograms of different numeric features and simple bar charts of different categorical features in our data.
- Bi-variate Analysis: As part of bi-variate analysis we would like to understand relationships, if any, between the target variable and features in our dataset. This also helps us validate any initial hypothesis we may have regarding the data. For eg. we may wish to know – Are the survival rates higher for males vis-a-vis females. Was the survival rate better for younger passengers compared to older ones and so on.
To perform this analysis, simply invoke the generate_exploratory_analysis_ppt function from the package as follows:
# The function takes 3 mandatory arguments
# df - A dataframe object to be analyzed
# target_var - The name of the target (or dependent) variable
# output_file_name = Output file name and destination path (output file is a PowerPoint deck - if only file name is provided, the file is saved in the current working directory)
library(RtutoR)
df = read.csv("train.csv") # Load the Titanic dataset
res = generate_exploratory_analysis_ppt(df,target_var = "Survived",
                                         output_file_name = "titanic_exp_report.pptx")

# If you wish to quickly test the functionality without downloading any external dataset, you could test it on one of the inbuilt datasets in R.
# For eg., using the iris dataset
res = generate_exploratory_analysis_ppt(df = iris,target_var = "Species",
                                         output_file_name = "iris_report.pptx")
Function output
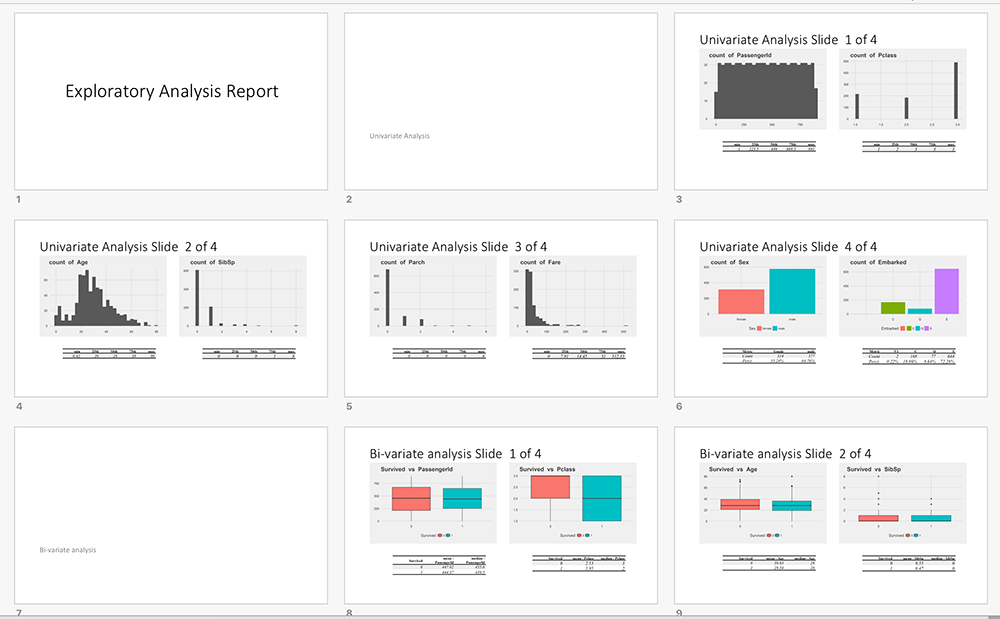
This function generates an Exploratory analysis PowerPoint Report (titled, titanic_exp_report.pptx) comprising of various different plots and related summary tables (Univariate and Bi-variate analysis output). The demo example output report is available in the Github repository for this project and can be downloaded from here.
An output object (named res in the example above) is also generated – This object can be used to view the plots and tables on the R console (and to use it for any subsequent analysis)
To view the contents of res object, simply type:
names(res)
# This will return
"univar" "bivar"
Basically, the output object contains the univariate and bi-variate analysis output. Analysis output is further categorized into plots and tables (as can be seen if we type names(res$univar) or names(res$bivar))
With the iris dataset example, all available univariate plots can be listed as follows:
names(res$univar$plots)
"Histogram - Sepal.Length" "Histogram - Sepal.Width"  "Histogram - Petal.Length" "Histogram - Petal.Width"
A brief note on possible errors
If you trying to run the example above, you may encounter couple of possible errors:
Error : .onLoad failed in loadNamespace() for ‘rJava’, details... ReporteRs library that the RtutoR package uses to generate ppt, relies on rJava and this error is caused by a mismatched Java version (e.g. you are running 32 bit Java on a 64 bit machine). You can read more about the issue here In my case, I was able to resolve this issue by downloading and installing a 64 bit version of Java (compatible with my 64 bit machine)
You may get an Error: Invalid column specification error. This may be due to an older version of tidyr installed on your machine. This error should be resolved if you upgrade to the latest version of tidyr – You could also simply remove the package and perform a fresh install. (This is actually a bug and caused by not specifying the correct version of the dependent package. I will be fixing it in the next release so that a manual upgrade is not required)
Explanation
As can be seen from the output report, the key idea behind this function is to automate some of the standard exploratory and visual analysis that’s performed as part of EDA. The function needs only 3 mandatory arguments to run (There are other arguments with default values that you can alter, which we will come to later):
df–> The dataset nametarget_var–> The target variable (or the dependent variable)output_file_name–> The output file name for the PowerPoint deck that is generated by the function. If only the file name is provided, the output powerpoint file is saved in the current working directory. To save to a specific folder, provide the full file path. The specific plots and the summary analysis generated by the function, depends on the datatype of the feature and target variable:
For Univariate analysis
If the feature is numeric, a histogram is plotted along with a five number summary table. If the feature is categorical, a bar plot is plotted indicating the count of different unique values (or factor levels) for that feature.
Bi-variate analysis
The specific plot that is used to plot the relationship between the Target variable and the feature again depends on the data types:
- Target Variable is Categorical while the Feature is Continuous (or vice versa): A box plot is used to plot the relationship
- Target Variable is Categorical and the Feature is also categorical: A bar plot indicating the proportions are plotted. A bar plot with proportions, rather than absolute counts, makes it easier to visualize the relationship between the feature and the target variable
- Both Target and Feature variable is Continuous: A scatter plot with a smoothing line is used to depict the relationship
Note
Depending on the data type(s), the function uses commonly used/recommended plot types, with default settings (e.g. default bin size in the case of histograms). Depending on the nature of your data and specific requirements, additional analysis and plots may be required – For e.g. you may wish to change the bin size for Histograms, change the default smoothing function being used (in the case of scatter plots) or use a different plot to visualize relationship (for e.g. instead of a box plot, overlapping histograms or density plots can be used). The current version of the package does not support changing the default plots and settings. Hence, custom plots if required would need to separately created. However, the package also contains a plotting app that provides an automated interface for some of the most commonly used plots and functionalities in ggplot2. I had previously blogged about this functionality here & here.
Other Function Arguments
Now that we have seen how the basic version of the function works, let’s look at some of the other arguments with default values that you can override. These are:
-
n_plots_per_slide: You can control the number of plots (with corresponding tables) to be included in each slide. There are 2 option – “1” or “2” with the default value being 2. If this is changed to 1, only 1 plot (and related table) is displayed on each slide. -
plot_theme: ggplot2 is used for generating all the plots that the function generates. ggplot2 has a few different plot themes to choose from, Additionally, the ggthemes package provides a whole set of different plot themes.By default, the function uses the theme_fivethirtyeight() from ggthemes. (I will talk more about the different themes available and how to choose one, when we discuss the Shiny app version of this function) -
top_k_features: If there are lot of features in your dataset, the resulting analysis and the output PowerPoint report can be massive. For eg, if there are 100 features in your dataset (and one target variable), the final output will include 200 plots and related tables (100 for Univariate and 100 for bi-variate analysis). To reduce the number of features to be considered for analysis, a simple feature screening can be performed. By default this argument is set to NULL. if feature screening is required, simply provide an integer value to this argument, indicating the number of features to be used for analysis. -
f_screen_model: This argument is relevant only if a non-null value is provided to thetop_f_features argument. There are various different techniques for feature screening broadly classified under (a) Filter methods and (b) Wrapper methods. The function uses few of the filter methods available as part of the FSelector package. There are 4 different filtering methods provided –chi.squared,information.gain,gain.ratio,symmetrical.uncertainty(You can go through theFSelectordocumentation for more information on these filtering methods) -
max_levels_cat_var: For categorical predictors, if the no of factor levels (or unique values for character class) is greater than this argument, the variable is omitted from the analysis (The default value is 10). In our Titanic dataset example, you will see that the Passenger name variable is not included in the output because the factor levels is > 10. The default value of 10 can be changed if required, by specifying a different value to this argument. -
group_names: Often times, while plotting the relationship between the Target variable and your feature, we would also like to visualize the relationship on some additional grouping variable. For eg. we wish to visualize the relationship between Survival Rates and Age grouped as per the Gender of the passenger. This can be done by specifying additional grouping variable (or multiple grouping variables) to this argument. Please note that this would generate all possible combinations of Target Variable and Features with the grouping variable (for eg. if there are 10 features, excluding the grouping variable, 10 new plots would be created). If the number of such combinations are large, you may wish to do an initial feature selection to reduce the number of features considered for analysis.
Now let’s re-invoke the function we saw previously, by altering some of the default argument values.
library(RtutoR)
res = generate_exploratory_analysis_ppt(df,target_var = "Survived",
                                         top_k_features = 5,
                                         f_screen_model = "information.gain",
                                         group_name = "Sex",
                                         output_file_name = "titanic_exp_report_2.pptx")
Compared to the previous version, there are 2 key changes that we have made:
-
We have considered only the top 5 features for analysis (the top 5 features are selected using the “information.gain” filtering method)
- We have performed additional bi-variate analysis with a grouping variable (“Sex”)
You can download the output PowerPoint report that this function generates, here (A screenshot is provided below for easy reference)
Shiny App version of the function
The package also provides a Shiny App version of the function. You can view a demo of the app here.
To launch the app simply invoke the following function:
gen_exploratory_report_app(df)
Only the dataframe needs to be passed as an argument to the function. All other argument values (target_var, plot_themes etc) are provided as Input fields in the app. Once the argument values are selected or entered (and default argument values changed, if required) the Generate Report button should be clicked to generate the exploratory analysis ppt.
The app version of the function makes it easier to view the list of valid options for each argument – For e.g you can view the list of all available plot themes.
However, the key advantage of using the app version to generate the report, is the Interactive plot output that the app provides. Once the report is generated, individual plots can be displayed on the Plot Output pane. Dropdown options are provided to select any particular plot from the set of output plots.
However, instead of the static plots that the PowerPoint report contains, the plots displayed on the app are interactive in nature (using the plotly library for interactivity). This makes it ideal for exploratory analysis – For e.g. you can zoom in on a section of the plot, switch on/off specific levels in a categorical variable and so on.
Conclusion
I hope that the package and the functionalities that it provides help meet the desired objective of enhancing the speed and efficiency with which data analysis can be performed so that more time can be spent on value adding & hard-to-automate tasks such as Feature Engineering, Insights generation, Story-telling etc.
Do give the package a try and in case of any issues do feel free to highlight it the Issues section of the Github repository for this project.
Hi Anup,
Getting could not find function
“generate_exploratory_analysis_ppt” error after running the
generate_exploratory_analysis_ppt function in R.
Could you please help me to resolve this issue.
Hello Anup,
Very interesting post. Can the app be used with dates and times variables ?. It seems to omit them in the output.
Thanks!